Market Segmentation
Market segmentation represents a cornerstone of modern marketing strategy, evolving significantly over time. Initially rooted in more quantitative approaches, contemporary segmentation practices increasingly integrate qualitative insights to achieve a comprehensive, 360-degree understanding of the customer.
Segmentation and the subsequent selection of target markets are fundamental components of a data-driven marketing approach.
The core idea is to move away from a mass-market perspective towards a more focused strategy that recognizes the heterogeneity of consumer needs and preferences.
By systematically dividing a broad market into distinct subsets of consumers who share common needs, characteristics, or behaviors, companies can more effectively tailor their marketing efforts. This process is intrinsically linked to data analysis, utilizing customer information to identify these groups and inform decisions about which segments offer the most viable opportunities for the company to serve.

Following segmentation, targeting involves evaluating the attractiveness of each identified segment and selecting one or more segments to enter. The company decides which specific groups of customers it aims to serve, aligning this choice with its resources, objectives, and capabilities. Finally, positioning involves formulating a distinct value proposition and market image for the product or service in the minds of the target customers.
Market Strategies Based on Expressed Consumer Preferences
Companies can adopt several strategic postures towards market segmentation, largely dictated by the pattern of consumer preferences within that market.
One theoretical possibility is undifferentiated marketing, where the company ignores segment differences and targets the entire market with a single offer. This approach is viable only when consumer needs are largely homogenous, exhibiting concentrated preferences where most consumers desire similar attributes. However, in today’s diverse markets, this strategy is rarely applicable as it fails to address varying customer requirements effectively.

At the opposite extreme lies maximum customization (or one-to-one marketing). This strategy is appropriate when consumer needs are highly diverse and spread out, reflecting diffused preferences: each customer ideally requires a unique offering. While technological advancements in marketing automation and personalization have made this more feasible in certain digital contexts (like personalized content delivery), creating distinct physical products or comprehensive service packages for every individual customer remains largely impractical due to prohibitive costs and complexity.
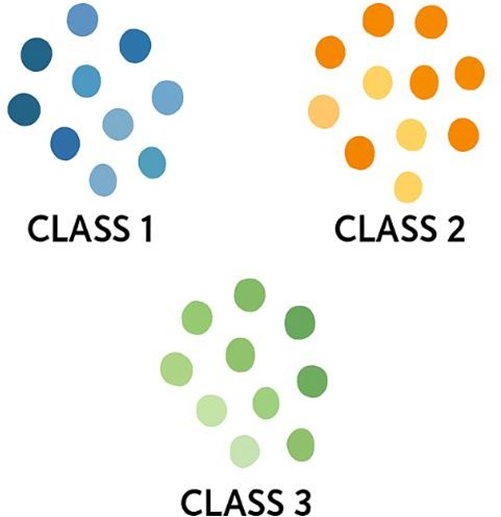
The most common scenario involves markets with clustered preferences, where distinct groups (or segments of consumers) share similar needs and desires, while these needs differ significantly between groups. This situation necessitates differentiated marketing, where the company identifies these segments and designs separate offers for each.
Segmentation Process
Segmentation can initially be based on a single variable (e.g., geographic location, purchase frequency). Consequently, multi-variable segmentation is the predominant approach in contemporary marketing, using multiple variables across different categories (geographic, demographic, psychographic, behavioral) to define segments.
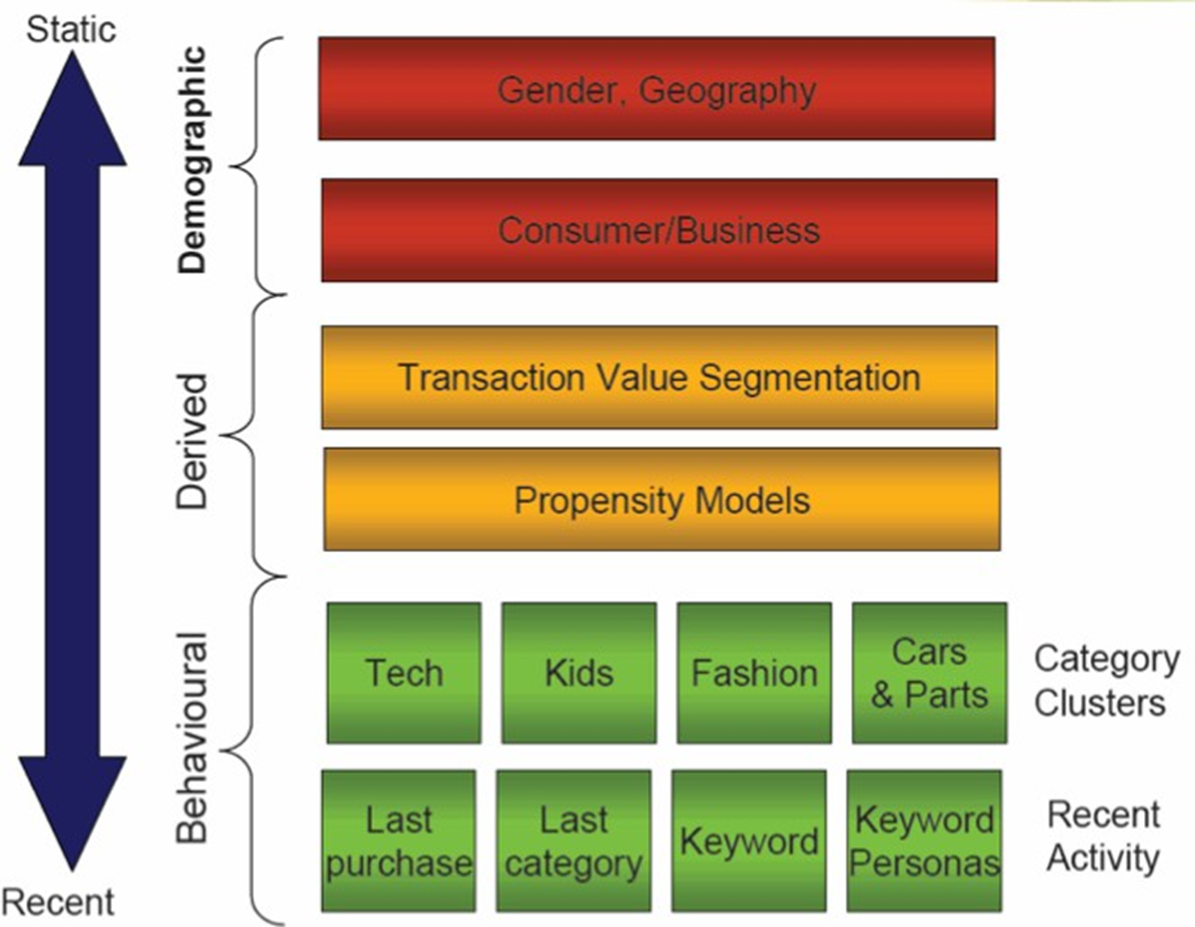
Executing a robust market segmentation involves a systematic process and the careful selection of relevant variables. The primary categories of variables commonly employed include:
- Geographic Variables: These relate to the physical location of consumers, such as country, region, city size, population density (urban, suburban, rural), or climate.
- Demographic Variables: These encompass readily measurable population characteristics like age, gender, family size, family life cycle stage, income, occupation, education level, religion, ethnicity, and socioeconomic status. Demographic variables are widely used due to their accessibility but may not always be the best predictors of consumer behavior on their own.
- Psychographic Variables: These delve into the intrinsic qualities of consumers, including personality traits, values, attitudes, interests, opinions (AIOs), and lifestyles. Psychographic segmentation provides deeper insights into consumer motivations but can be more challenging to measure accurately.
- Behavioral Variables: These segment consumers based on their knowledge of, attitude towards, use of, or response to a product or service. Key behavioral variables include:
- purchase occasion
- benefits sought (e.g., quality, service, economy)
- user status (non-user, ex-user, potential user, first-time user, regular user)
- usage rate (light, medium, heavy)
- loyalty status
- readiness stage (unaware, aware, informed, interested, desirous, intending to buy)
- attitude toward the product
An important distinction exists between these variable types concerning their stability.
- Geographic and demographic variables tend to be relatively static, changing slowly over an individual’s lifetime (though aggregate market demographics evolve)
- Psychographic (attitudes, lifestyles) and especially behavioral variables (purchase habits, brand loyalty, usage rates) are often more dynamic, potentially changing more frequently in response to market trends, life events, or marketing interventions.
Relying solely on static variables may lead to outdated or inaccurate segment profiles. Combining multiple variable types provides a more robust, multi-faceted view essential for sophisticated targeting.
Market segmentation is the foundational first step in a broader strategic framework often referred to as STP: Segmentation, Targeting, and Positioning.
- Segmentation: This step involves dividing the market into distinct groups of buyers based on differing needs, characteristics, or behaviors. Analytical techniques like clustering or heuristic methods help identify segments, but successful segmentation also relies on the critical step of profiling.
- Targeting: Companies evaluate the attractiveness of each segment considering factors like size, growth, profitability, accessibility, and competition. Based on this analysis and company objectives, one or more segments are selected for marketing efforts. Strategies include concentrated (one segment), differentiated (several segments), or undifferentiated (broad market) approaches, chosen to match opportunities with the company’s capabilities.
- Positioning: This step determines how a product or service is presented to occupy a clear and desirable space in the minds of target consumers, relative to competitors. It involves identifying competitive advantages, developing a positioning concept or value proposition (e.g., “best quality”), and consistently communicating it through all elements of the marketing mix to ensure alignment with consumer perceptions.
Steps
The overall segmentation process typically unfolds in six main stages:
- Identify segmentation variables and segment the market: this involves selecting the most relevant variables from the data pool and applying clustering algorithms or heuristic methods to identify distinct segments.
- Develop profiles of the resulting segments: this step involves creating detailed descriptions of each identified segment based on their behavioral, demographic, and psychographic characteristics.
- Evaluate the attractiveness of each segment: this involves assessing the size, growth potential, profitability, accessibility, and alignment with the company’s objectives and resources.
- Select one or more segments to target: this step involves deciding which segments the company can serve most effectively and profitably.
- Identify the positioning strategy for each target segment: this involves defining how the company’s offering will be perceived by target customers relative to competing offerings.
- Select and communicate the marketing mix for each target segment: this step involves developing a tailored marketing mix (product, price, place, promotion) for each target segment and ensuring consistent communication of the positioning strategy.
Important
It is important to stress that segmentation is not solely a data science or technical task. Even when sophisticated statistical models or machine learning algorithms are employed, the ultimate utility of a segmentation depends heavily on its integration with business objectives. Technical experts working on segmentation must constantly interact with marketing teams, product managers, and other stakeholders to ensure that the segments identified are usable in the real market environment.
True segmentation requires a structured approach that unfolds in three main stages, each with distinct objectives and methodologies.
| Activities | Objectives | |
|---|---|---|
| Survey Phase | - Assess available internal data (e.g., purchase histories, customer profiles) - Identify gaps requiring external data collection through structured interviews, focus groups, or broader surveys - Explore customer behaviors, preferences, attitudes, brand perceptions, and product usage patterns | Gather comprehensive and meaningful information about customers or the intended market |
| Analysis Phase | - Use theoretical grounding and empirical methods (e.g., correlation or factor analysis) to choose meaningful variables - Apply clustering algorithms, statistical models, or heuristic methods to identify customer segments that are internally consistent (homogeneous) yet distinct from other groups (heterogeneous) | Analyze and select the most relevant variables for segmentation |
| Profiling Phase | - Describe each segment in terms of behavioral, demographic, and psychographic characteristics - Understand motivations and interactions with the brand or product category | Transform technical output of clustering into detailed, actionable insights |
Criteria for Effective Segmentation
For market segmentation to be strategically useful, the identified segments should meet several key criteria:
- Measurable: The size, purchasing power, and key characteristics of the segments must be quantifiable.
- Substantial: The segments need to be large enough or possess sufficient purchasing power to be profitable to serve.
- Accessible (Approachable): The company must be able to effectively reach and serve the members of the segment through its marketing and distribution channels.
- Differentiable: The segments must be conceptually distinguishable and respond differently to various marketing mix elements and programs. If married and unmarried women respond similarly to a perfume sale, they do not constitute separate segments for that context.
- Actionable: It must be possible to design effective marketing programs to attract and serve the segments. The company must have the resources and capabilities to cater to the specific needs of the chosen segments.
- Internally Consistent (Homogeneous): Members within a segment should be as similar as possible regarding the characteristics relevant to segmentation.
- Externally Different (Heterogeneous): Segments should be as different from each other as possible.
- Business Relevant: Beyond statistical significance, the segments must provide meaningful insights that align with the company’s strategic goals and operational capabilities. Sometimes, a segmentation solution with slightly lower statistical optimality but greater clarity and relevance for business operations might be preferred (e.g., choosing five well-defined, actionable segments over seven statistically distinct but operationally complex ones).
Targeting Market Segments
Following the identification and profiling of distinct market segments, the next critical step in the process is targeting. Targeting involves evaluating the various segments identified during the segmentation phase and selecting one or more segments to enter. This selection process requires careful consideration of segment attractiveness and the company’s capabilities.
Companies typically assess segments based on factors such as:
- Segment Size and Growth: Is the segment large enough and does it have sufficient growth potential to be profitable?
- Segment Structural Attractiveness: Considerations include the level of competition within the segment, the potential threat of substitute products, the bargaining power of buyers, and the bargaining power of suppliers.
- Company Objectives and Resources: Does targeting the segment align with the company’s long-term goals, capabilities, and available resources? Can the company offer superior value and gain a competitive advantage within that segment?
B2B Targeting Example
In a business-to-business (B2B) context, targeting might involve a multi-stage process:
- Initial Screening (Firmographics/Geographics): Selecting potential markets based on company size, industry, and geographic location, perhaps focusing on specific regions or countries aligned with the company’s operational footprint (e.g., a multinational choosing specific geographical areas).
- Assessing Fit (Environmental & Technological): Evaluating whether the company’s product or service (e.g., a technologically advanced B2B solution) aligns with the business environment and technological infrastructure of potential client companies in those markets (e.g., suitability for developed vs. developing countries based on technological readiness).
- Understanding Client Profiles (Psychographics/Behavioral): Assessing factors like the potential client’s technology adoption profile, openness to innovation, and overall business complexity.
- Aligning Needs and Capabilities: Matching the company’s offerings and business drivers with the potential client’s identified needs, urgency, and strategic priorities. This includes exploring possibilities for complementary products or services.
- Identifying Buyer Personas: Determining the specific roles and individuals within the target organizations who are involved in the purchasing decision process (e.g., procurement function, technical evaluators, senior management) and understanding their specific motivations and criteria.
Clustering
While sophisticated statistical clustering algorithms are powerful tools for segmentation, simpler heuristic approaches are also widely used, often relying on expert judgment or straightforward rules. These methods can provide actionable segments without requiring extensive statistical modeling.
A classic example is RFM analysis, particularly common in direct marketing and retail. This technique segments customers based on three key transactional variables:
- Recency: How recently did the customer make a purchase?
- Frequency: How often do they purchase?
- Monetary Value: How much do they spend?
Customers are typically scored or ranked on each dimension.
Example
Combining these scores creates segments like
- “Best Customers” (high R, F, M)
- “Loyal Customers” (high F, moderate R/M)
- “Potential Loyalists” (recent, moderate F/M)
- “At-Risk Customers” (low R, F, or M)
- “Lost Customers” (very low R, F, M)
RFM provides a simple yet effective way to identify customer groups for targeted campaigns like reactivation, loyalty rewards, or upselling, based purely on observable purchase behavior.
Although the RFM method is based on simple rules and does not involve machine learning, it is highly practical for many real-world applications. The critical step lies in interpreting the resulting customer groups: businesses must analyze these segments to decide on differentiated marketing strategies, retention efforts, or customer acquisition campaigns.
Another structured heuristic is the Successive Elimination approach, useful when dealing with multiple potential segmentation variables. Instead of complex algorithms, it uses a logical process:
Steps
- creating a list of all possible segmentation variables
- variables identified as relevant are compared in pairs using a matrix
- unimportant “crossovers” and contradictions are eliminated
- variables are gradually combined to reduce the number of combinations
- products are entered according also to the different use functions
- the final product-market (segment) matrix is created
This method imposes structure on expert judgment, allowing for multi-variable segmentation in a manageable way, facilitating the identification of meaningful target groups by progressively narrowing down possibilities based on practical and strategic considerations.
However, by applying the successive elimination method, the analyst can rationally discard improbable or non-meaningful segments.
For instance, "high-tech culture" in a "developing economy" may exist but could be rare enough to be strategically ignored. Similarly, "small independent companies" operating in high-capital intensive markets might be deemed less relevant.
By systematically removing such combinations, the matrix becomes more manageable and actionable.
Through this process, segmentation is refined step-by-step. The final reduced matrix highlights only the strategically relevant intersections, facilitating the alignment of products, marketing campaigns, and sales strategies with the most promising market segments. Importantly, the entire approach remains heuristic in nature: while it introduces structure and rational decision-making, it still fundamentally relies on expert judgment to define what is relevant and feasible.
Common Clustering Techniques
When we talk about clustering, we refer to a set of techniques that aim to group similar entities together based on their characteristics. These techniques can be broadly categorized into four main types:
- Hierarchical Clustering: Suitable for smaller datasets or when cluster structure is unknown. It is typically used for customer lifetime value (CLV) analysis and profiling loyalty programs.
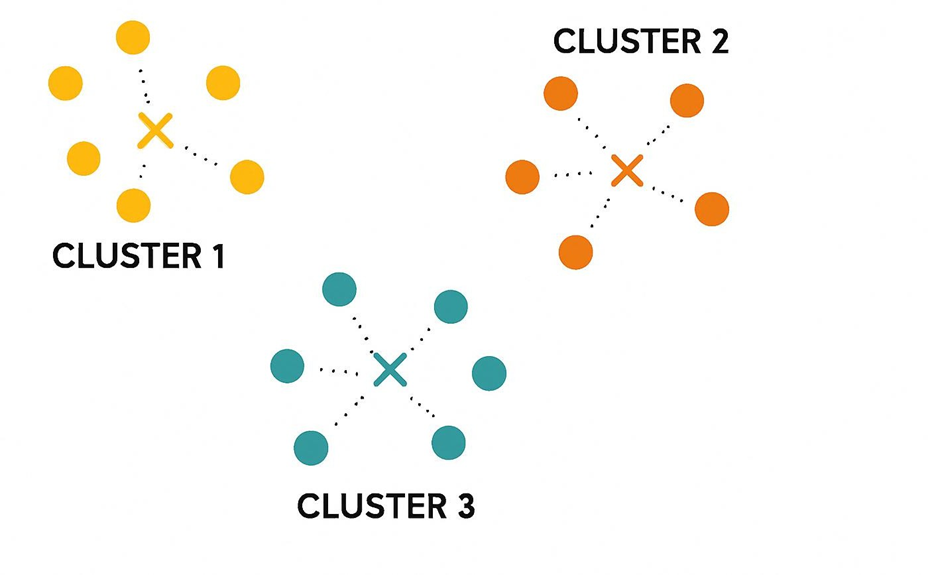
- K-Means Clustering: Widely used for customer segmentation, product categorization, and market basket analysis.
- Latent Class Analysis (LCA): Often used in social sciences, psychology, and market research to uncover hidden patterns in data.
- Complex ML-based Clustering: Suitable for dynamic personas, behavioral clustering from mobile app logs, clustering of unstructured content (e.g., user comments or reviews), and real-time segment creation for next best action systems.
Comparison
Latent Class Analysis (LCA) K-Means Clustering Hierarchical Clustering Data Structure Probabilistic assignment to latent classes based on observed patterns Works well with spherical clusters Builds a tree-like structure (dendrogram) Number of Clusters Must be estimated, often with model selection criteria (e.g., BIC) Must be defined in advance (K) No need to pre-define number of clusters Scalability Moderate scalability, suitable for medium datasets Fast and efficient for large datasets Less scalable, more computationally intensive Noise Handling Robust to noise (probabilistic membership) Sensitive to outliers Sensitive to noise Distance Metric Based on probability models, not distance metrics Euclidean distance (by default) Various metrics can be used Interpretability High (class probabilities and profiles are easy to explain) Easy to interpret and visualize Dendrogram can be complex to interpret Best Use Case Survey data segmentation, attitudinal or behavioral profiling Large, well-separated clusters Smaller datasets, hierarchical structure
Latent Class Analysis (LCA)
Latent Class Analysis (LCA) is a probabilistic, model-based clustering method used to uncover latent (hidden) groupings within data. Unlike deterministic methods such as K-means, LCA assigns each data point probabilistically to multiple classes, allowing for overlap and uncertainty between groups. Analysts:
Steps
- Choose the number of latent classes
- Estimate class membership probabilities for each point
- Assign individual probabilistically. Each individual is assigned to a latent class based on the highest probability.
LCA is particularly valuable in exploratory analyses where the number or nature of clusters is unclear, often applied in fields like psychology and market research to reveal behavioral patterns or attitudes stemming from latent subgroups. The process can be complex, involving the estimation of numerous parameters and reliance on model selection criteria (e.g., BIC or AIC) to identify the optimal number of classes. Despite its complexity, LCA offers robust insights when understanding latent structures is key to decision-making.
K-Means Clustering
K-Means clustering is a popular, efficient method for segmenting structured numeric data into predefined clusters (denoted as
Algorithm
- Choose the number of clusters
. - Assign each data point to the nearest centroid (the center of a cluster).
- Recalculate the centroids as the mean of all points assigned to each cluster.
Its primary goal is minimizing intra-cluster variance, ensuring tight grouping of points within clusters. Although praised for speed and computational efficiency, K-means requires the number of clusters to be predefined and is sensitive to initial centroid placement and outliers, which limits its ability to capture complex data relationships.
To determine the optimal number of clusters (
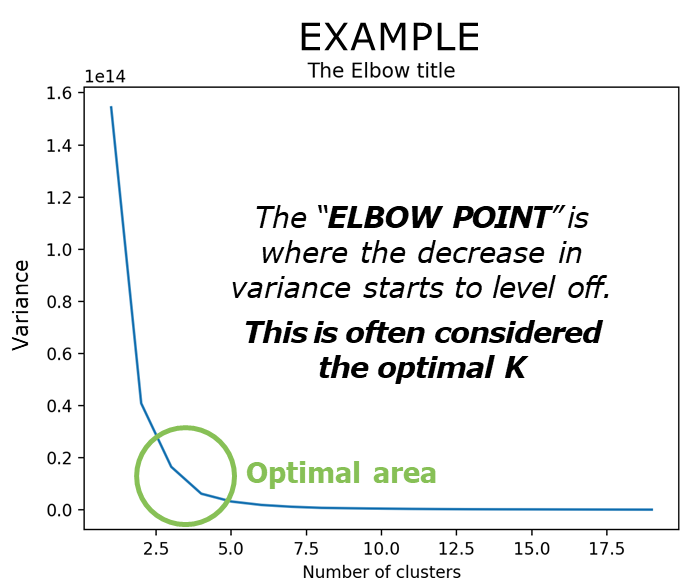
- The method involves plotting the number of clusters (
-axis) against the variance or within-cluster error ( -axis). - Initially, adding more clusters significantly reduces the variance, as groups become more compact.
- The “Elbow Point” represents the stage where this reduction slows noticeably, marking the optimal K. Beyond this point, adding clusters leads to diminishing returns.
This method is widely used due to its simplicity and effectiveness, but it has limitations:
- Precision vs. Practicality: Increasing the number of clusters improves segmentation detail but adds complexity and operational challenges.
- Selecting
requires balancing statistical accuracy with the business’s capacity to utilize and manage segments effectively.
Hierarchical Clustering
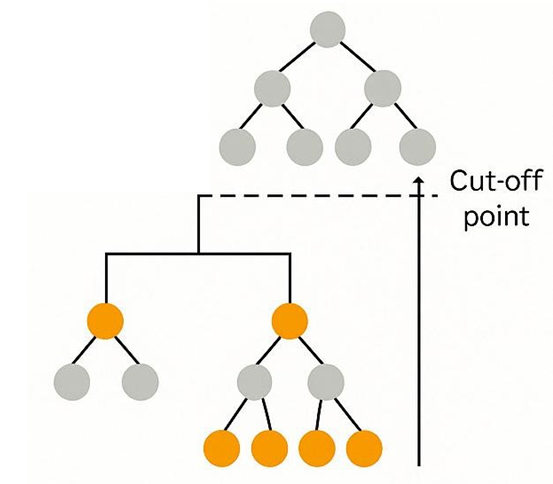
Hierarchical clustering builds a tree-like structure (dendrogram) of clusters without requiring
- Agglomerative: Starting with individual points and merging closest clusters iteratively.
- Divisive: Starting with one large cluster and splitting it iteratively.
This approach provides nested clusters, allowing analysts to select the desired granularity by cutting the dendrogram at appropriate levels. Hierarchical methods are highly interpretable due to their visualization capabilities, making them ideal for datasets with nested structures (e.g., multinational sales data divided by regions). However, computational complexity limits their use for large datasets.
From Target Segmentation to Dynamic Personas
The traditional approach to customer targeting originated with basic segmentation methods. Initially, segmentation involved using numerical data through qualitative and quantitative methodologies. These early models focused on grouping individuals based on measurable characteristics such as age, gender, income, and geographic location. The objective was to define a fixed “target” audience whose shared attributes made them easily reachable and predictable.
However, with the digital revolution and the rise of multi-channel environments, multi-screen behavior, and an increasingly distracted, mobile audience, this model has become insufficient. Consumers today interact with brands in more fragmented, dynamic ways. Their behaviors are influenced by real-time contexts and emotional states rather than static characteristics alone. Consequently, merely adding more variables to traditional segmentation is no longer enough.
From Targets to Personas
This evolution in understanding leads us to the concept of “personas,” a more sophisticated method for defining and engaging with customers. Unlike traditional targets that focus on demographic and psychographic variables, personas integrate deeper insights into consumer motivations, behaviors, and decision-making processes. Through personas, organizations can move beyond simply knowing who the customer is demographically, to understanding how and why they act.
Definition
A persona represents a semi-fictional archetype of a customer, created from a blend of real data and informed assumptions. It synthesizes various characteristics—such as goals, frustrations, habits, and environments—into a coherent narrative that captures the essence of a group of users.
Using personas enables businesses to empathize with customers more effectively, designing products, services, and communications that resonate with their real-world experiences and emotional needs.
History and Development of Personas
Personas, contrary to popular belief, are not a recent invention. The first formal use of personas dates back to 1993, when they were introduced as tools to help web designers and software developers better understand and anticipate user needs. In these early applications, personas were used to guide the creation of user interfaces that were more intuitive and aligned with how different types of people interacted with technology.
The concept was further formalized and popularized by Alan Cooper in 1998 through his influential work in user experience (UX) design. Cooper introduced personas as a standard practice, emphasizing their importance in human-centered design processes. Initially confined to the design and usability fields, the methodology eventually expanded into broader areas such as marketing, customer relationship management, and strategic planning.
Today, personas are used not only to design digital products but also to inform brand positioning, content marketing strategies, sales approaches, and customer service models. They have evolved into a multidisciplinary tool that supports a wide range of business functions wherever deep customer understanding is required.
Types of Personas
There are different categories of personas, each serving distinct strategic purposes.
- User personas focus on improving user experience by imagining how various archetypal users interact with digital products such as websites and mobile applications. These personas inform features, user journeys, and interface designs by grounding decisions in user needs rather than subjective assumptions.
- Buyer personas are more closely related to marketing and sales. They capture the characteristics, motivations, and decision-making behaviors of individuals who purchase products or services. Understanding why buyers make purchasing decisions, what their pain points are, and how they evaluate alternatives helps businesses craft more effective marketing strategies and sales pitches.
- Customer profiles blend persona narratives with socio-demographic attributes to create complete portraits of ideal customers. This type of persona is particularly useful when a business needs to integrate qualitative insights with measurable market segments for operational purposes.
When comparing traditional targets to personas, the difference in depth and utility becomes immediately apparent.
- A traditional target might be defined by a set of demographic variables such as age, gender, occupation, and income level. While this data is valuable, it provides only a superficial view of the customer. It lacks the context necessary to understand behaviors, needs, and emotional drivers.
- A persona, on the other hand, goes beyond these basic attributes. It includes not only demographic information but also psychographic insights, behavioral patterns, and emotional triggers. For example, a target might be described
Pain and Gain
One of the most fundamental concepts when discussing personas in marketing and design is the notion of pain.
Definition
In this context, pain does not refer to physical suffering, but rather to a profound and often subconscious need that drives human behavior. It represents a deep, often unarticulated, motivation that influences how individuals make decisions.
To better understand how consumers process stimuli and make decisions, we can reference the Triune Brain Theory proposed by Paul D. MacLean in the 1960s. According to this model, the human brain is divided into three parts: the neocortex, responsible for language, reasoning, and higher cognitive functions; the limbic system, associated with emotions and feelings; and the reptilian brain, the most primitive part of the brain, concerned primarily with survival instincts and immediate reactions.

What is particularly significant for understanding consumer behavior is that decisions are often made not by the rational neocortex, but by the reptilian brain. When consumers make purchasing choices, they do so instinctively and emotionally within just a few seconds. During these critical moments, there is no conscious evaluation of brands, products, or companies—only an immediate response to fundamental needs. Therefore, when designing a persona, identifying and addressing a deep and authentic pain is crucial. This pain must tap into core emotional or survival-driven needs, bypassing superficial marketing messages.
From pain naturally arises the concept of gain, which can be seen as the positive counterpart.
Definition
Gain represents the aspirational success or personal gratification that the persona seeks.
In strategic terms, if a product or service can alleviate the identified pain and simultaneously help the persona achieve a desirable gain, it greatly increases the likelihood of influencing their decision.
The Dynamic Persona Model
Initially, personas were developed as a significant improvement over basic target segmentation, which relied on broad demographic and geographic characteristics. However, early personas still present notable limitations. Traditional personas are inherently static: they assume that an individual behaves consistently across all contexts of life, whether at home, at work, or during leisure activities. This oversimplification fails to account for the dynamic and multifaceted nature of real human behavior.
Moreover, classical persona models do not adequately incorporate the impact of evolving social environments, such as the rise of mobile technology and multi-channel interactions. Nor do they sufficiently consider the contextual nuances that heavily influence consumer behavior. The same person may react very differently to a brand message depending on their physical, emotional, or social setting at a given moment.
Recognizing these limitations has led to the development of the Dynamic Persona Model. In this framework, a persona is not treated as a fixed entity but as a dynamic system that adapts across different life contexts and micro-moments. Every persona is viewed as possessing multiple “masks” or facets, each corresponding to different roles or states of mind.
For example, the same individual can simultaneously embody the roles of employee, parent, athlete, or student, with each role slightly altering their priorities, perceptions, and emotional sensitivities.
Each mask brings about subtle changes in the persona’s pain points and gains. Consequently, communication strategies must be adapted to the mask currently active in the persona’s life. A message that resonates while the persona is in a professional context might fail when they are in a personal or recreational setting. This approach draws parallels with literary and philosophical concepts of identity fluidity, such as the idea that every person is seen differently by every other person (as suggested in Pirandello’s work) and the relativity of perception described by Einstein’s theories.
The emphasis on contextual relevance becomes paramount. For instance, a consumer asked to pay three euros for a can of soda may react differently based on where they are: they might find it unacceptable in a supermarket but perfectly reasonable in a desert where thirst and survival instincts dominate. This underlines that context directly influences perceived value and decision-making.
Strategic Advantages of the Dynamic Persona Model
Adopting a dynamic approach to personas yields several key advantages.
- It allows brands to map customer journeys more accurately, acknowledging the various phases through which a consumer may pass. This nuanced understanding enables brands to tailor interactions and select the most appropriate mask to engage with, ensuring greater resonance.
- It provides a richer understanding of the consumer’s multiple pain and gain profiles. No longer limited to a single, static motivation, marketers can identify and address specific needs linked to each mask or role the consumer adopts. This differentiation leads to far more precise segmentation and communication strategies.
- It places a strong emphasis on timing and context. By identifying the most receptive moments—those in which a consumer’s current mask aligns with the brand’s value proposition—companies can significantly enhance the effectiveness of their messages. This insight extends across service design, content strategy, segmentation, profiling, and the construction of multi-channel ecosystems.
Case Study: Consumerpharma
Consumerpharma is the Italian branch of a major European pharmaceutical conglomerate operating in the broader pharmaceutical sector. As a multinational organization, it manages a diversified product portfolio that includes both prescription medications—which, as a regulatory requirement, must be authorized by a healthcare professional—and consumer health products, which are available for direct purchase at pharmacies without a doctor’s intervention. In this way, the company covers two strategic domains within the healthcare market: prescription-driven therapeutics and over-the-counter consumer solutions.
Beyond traditional pharmaceutical products, Consumerpharma has also invested in non-pharmacological pain management technologies. These include devices designed to alleviate pain through mechanical or physical means, such as vibration-based tools or therapeutic heating devices, commonly referred to as thermotherapy products. This extension of their portfolio illustrates a strategic approach to health management that incorporates both pharmacological and technological solutions.
The company’s primary objective in this project was to gain a deep, data-driven understanding of consumer behaviors and attitudes towards health and pain management across various markets. Specifically, Consumerpharma sought to identify and characterize different customer segments, aiming to comprehend why individuals choose specific products, the motivations driving these choices, and the broader behavioral patterns that define their interaction with health-related products. Importantly, this study had a global scope, encompassing multiple European markets to capture a comprehensive and comparative view.
To achieve this, the company deployed a quantitative segmentation approach. This method, grounded in statistical analysis, was chosen for its ability to objectively define and dimension customer groups based on empirical data. The segmentation study spanned five countries, involving approximately 400 consumers per market, resulting in a sample size sufficiently robust for cross-national comparisons without being prohibitively large. The outputs of the project included not only detailed segment profiles but also a typing tool, an essential component for operationalizing the segmentation within the company’s Customer Relationship Management (CRM) systems.
The typing tool plays a crucial role in embedding the segmentation findings into the broader technological ecosystem of the organization. By assigning CRM entries to specific segments, the company can enable targeted marketing strategies, personalized communication, content customization, and strategic prioritization of customer groups. This integration ensures that the segmentation delivers actionable insights rather than remaining an isolated analytical exercise.
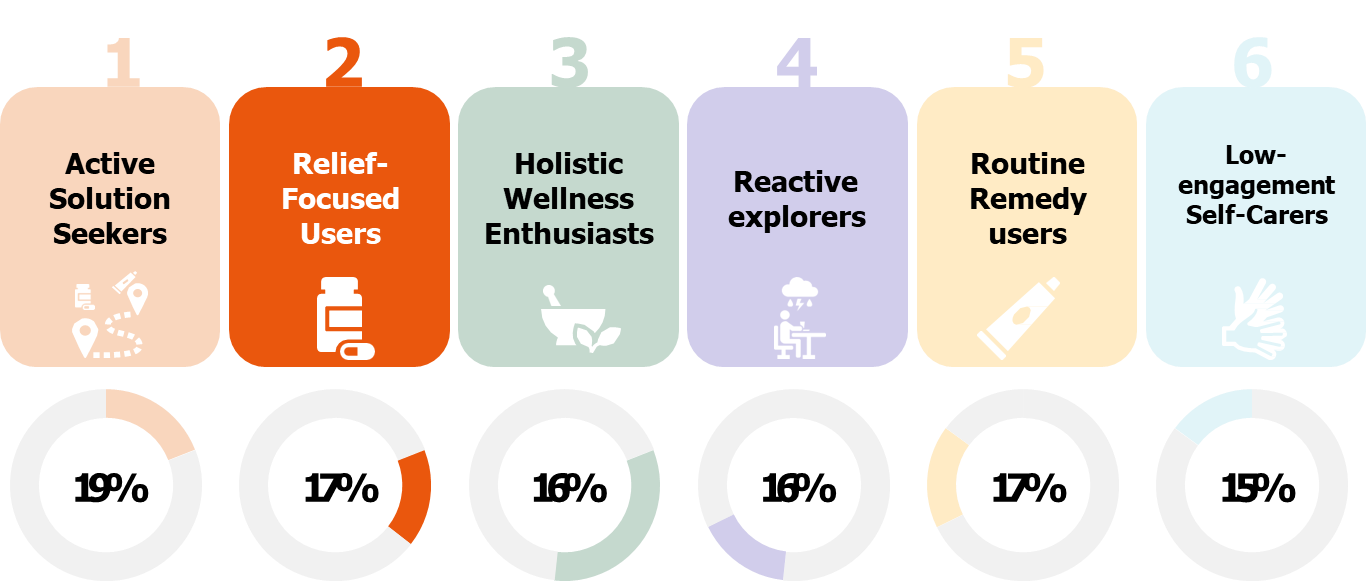
The quantitative research led to the identification of six distinct consumer segments. These segments were characterized not only qualitatively—by their behavioral attributes—but also quantitatively, by measuring their relative prevalence within the studied populations. This dual approach ensured both depth of understanding and strategic applicability.
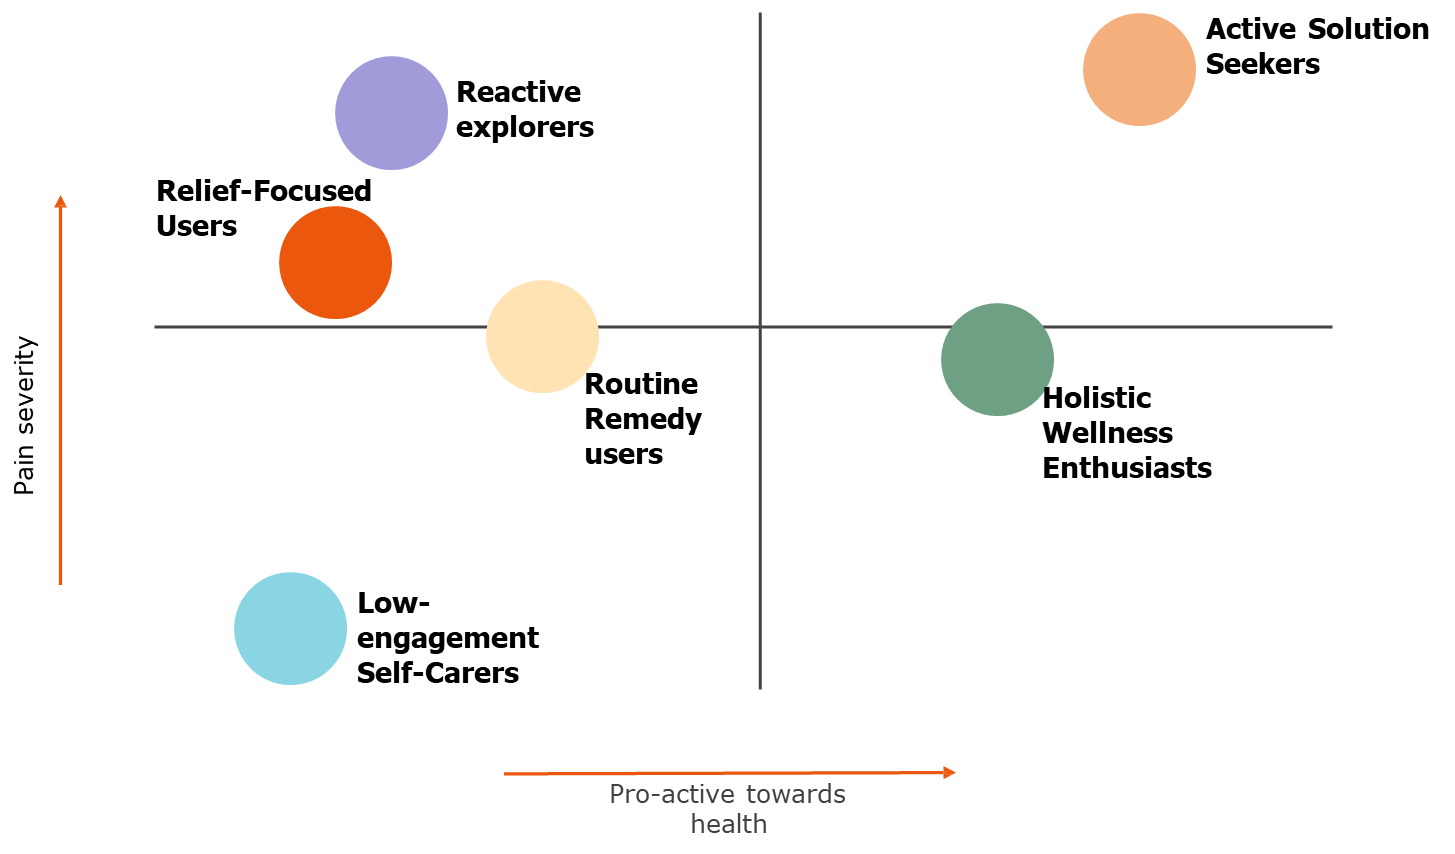
One advanced technique used in analyzing the segments was customer mapping. Segments were positioned within a two-dimensional space based on two critical variables: pain severity and proactiveness towards health management. This mapping allowed a visual and conceptual understanding of how different consumer groups relate to each other. For instance, in the top-right quadrant, the researchers identified consumers experiencing high levels of pain who were simultaneously proactive in seeking health solutions. Conversely, in the bottom-left quadrant, they found consumers with low pain severity who exhibited reactive behaviors, typically engaging with new products only when prompted by external circumstances.
Additionally, a subset of consumers termed reactive explorers emerged. These individuals experienced severe pain but tended to respond reactively rather than proactively. They typically sought advice from pharmacy personnel rather than independently exploring new treatment options, highlighting a behavioral pattern driven more by immediate necessity than by preemptive health management.
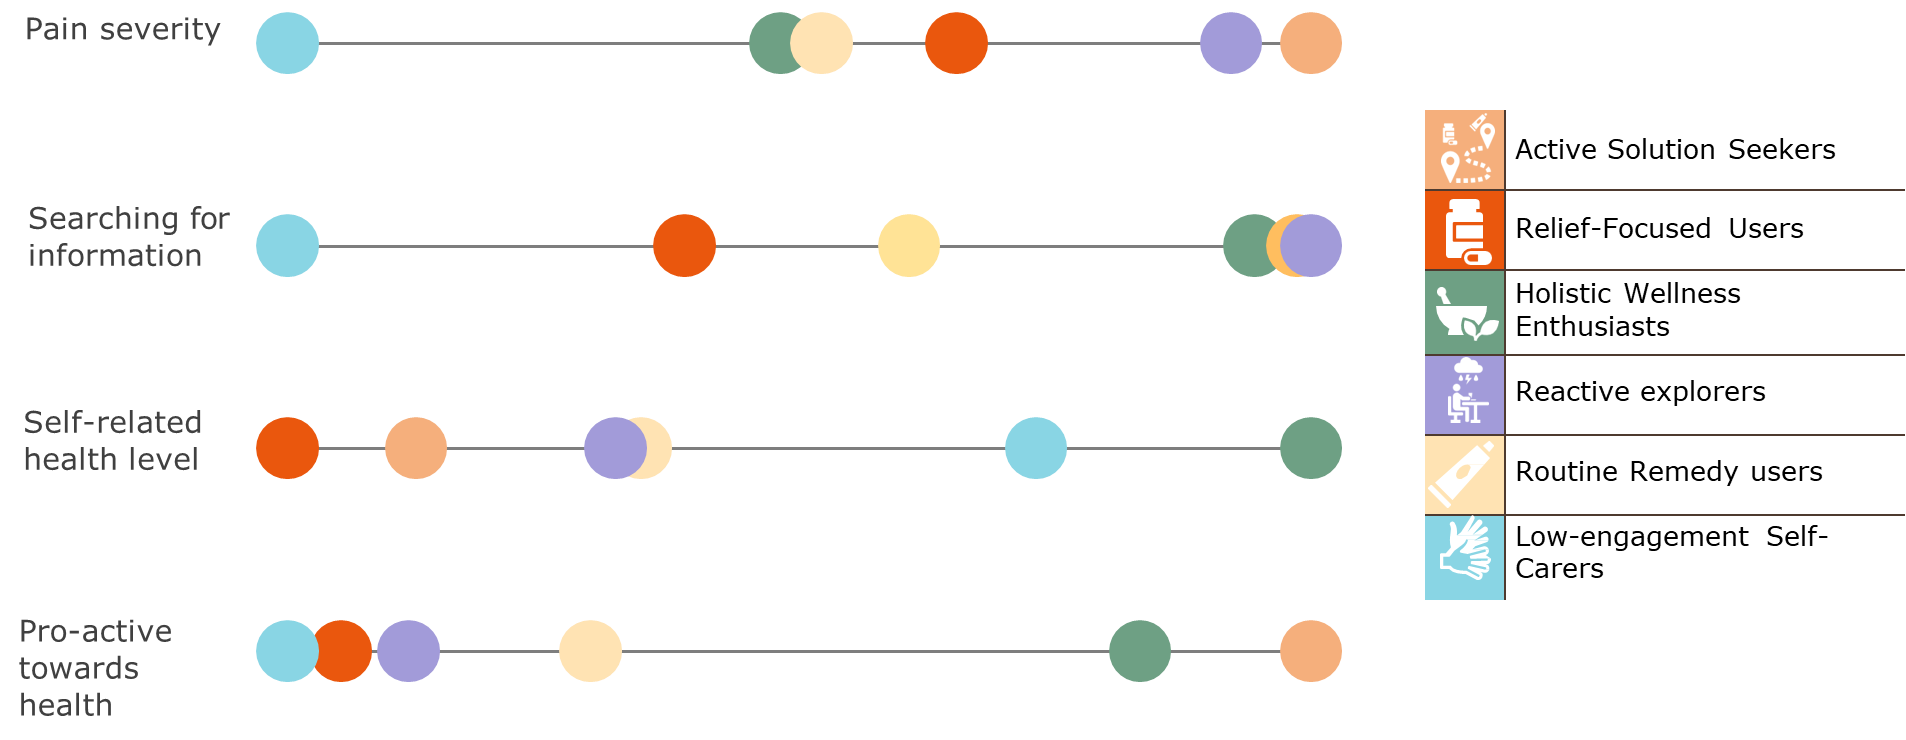
For more granular profiling, researchers also employed single-variable analyses, allowing them to detect nuanced differences within and across segments. When cross-variable mapping becomes impractical due to dimensionality, examining distributions along a single axis offers an alternative way to profile customer behavior, particularly useful in operational settings where quick categorization is required.
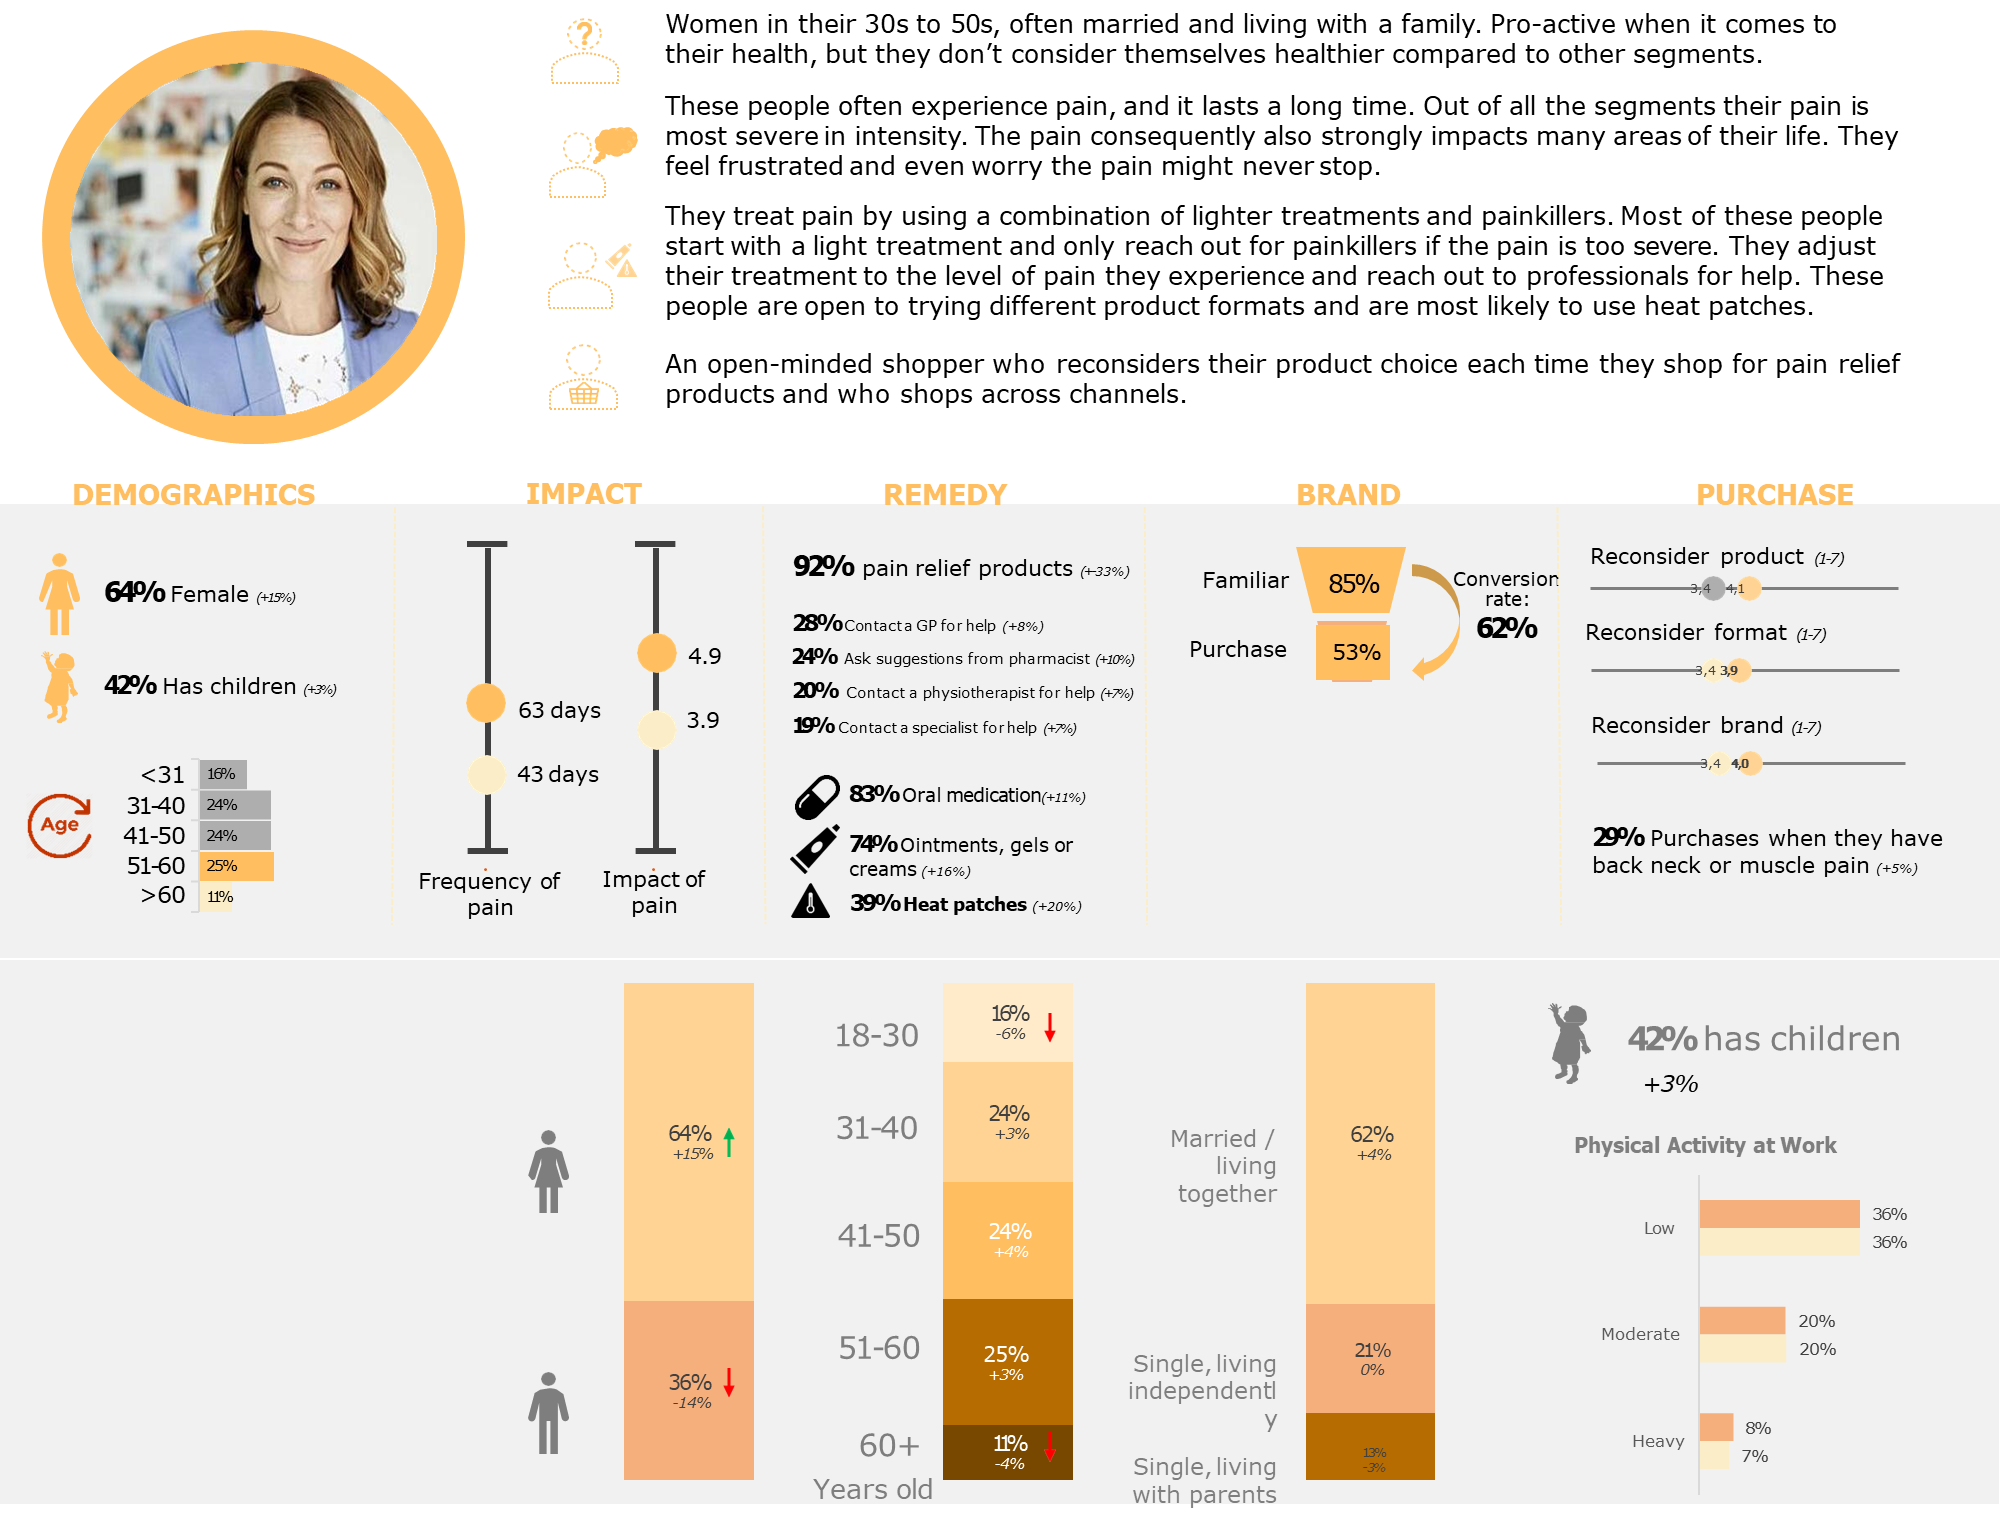
An example of one customer segment, Active Solution Seekers, illustrates how segmentation findings can evolve towards the creation of personas. Although initially based on quantitative clusters, these segments were humanized by integrating demographic and psychographic attributes. For instance, Active Solution Seekers were often characterized demographically as married individuals with children, suggesting that family responsibilities may correlate with a more proactive health management style. The personas were also enriched with lifestyle indicators, such as being “open-minded shoppers,” pointing to a greater willingness to explore innovative health solutions.
In describing each segment, the researchers included variables such as the frequency of pain episodes, the perceived impact of pain on daily life, and the attitudinal stance towards healthcare innovation. These variables closely aligned with the company’s initial research objectives, demonstrating a strong consistency between project goals and analytical outputs. Such detailed profiling not only aids strategic decision-making but also informs marketing communications, product development, and customer engagement strategies.
Importantly, while the initial segmentation is statistically derived, the final phase of the process—interpretive profiling—requires a deep understanding of the business context. Analysts must combine empirical data with business acumen to transform statistical clusters into actionable customer profiles. This phase emphasizes the necessity of aligning data insights with strategic and operational needs.
Finally, an alternative view of the segmentation results compared the characteristics of each segment against the overall population baseline. This comparative analysis allowed for a clearer understanding of how each segment deviates from the “average” consumer, providing further refinement for targeting and strategic planning purposes.
Case Study: Sciencepharma
The Sciencepharma case provides an insightful example of how pharmaceutical companies can leverage data to create customer segments. Unlike the previous case, which relied on survey-based data collection, this case involves using existing data within the company to conduct segmentation. The company in question is a multinational pharmaceutical giant with substantial revenue and an extensive product portfolio, primarily focused on prescription medicines. This distinction is important because, unlike consumer health products, the customers for prescription medications are primarily healthcare professionals (HCPs), such as doctors, rather than end consumers.
One of the core challenges faced by Sciencepharma was managing a wealth of data collected through multiple digital touchpoints. These touchpoints included, for example, email campaigns, interactions on the company’s proprietary HCP portal, and historical records of visits and engagement efforts. Despite having access to large amounts of data, the company struggled with translating this data into actionable insights. In particular, they lacked a clear and precise segmentation strategy. Their existing approach typically involved analyzing isolated data points rather than synthesizing them across multiple variables, which is critical for developing a comprehensive customer segmentation model.
To address this, a data-driven approach to segmentation was proposed. This methodology involved examining multiple variables to construct an omnichannel behavioral segmentation model. The objective was to identify how engaged different clinicians were with digital content and how much effort the company had expended to engage them. This effort included the time and resources spent visiting clinicians in person, sending email communications, and producing content for scientific papers. These measures of engagement, in combination with the clinicians’ digital affinity (their willingness to engage with digital content), formed the basis for the segmentation.
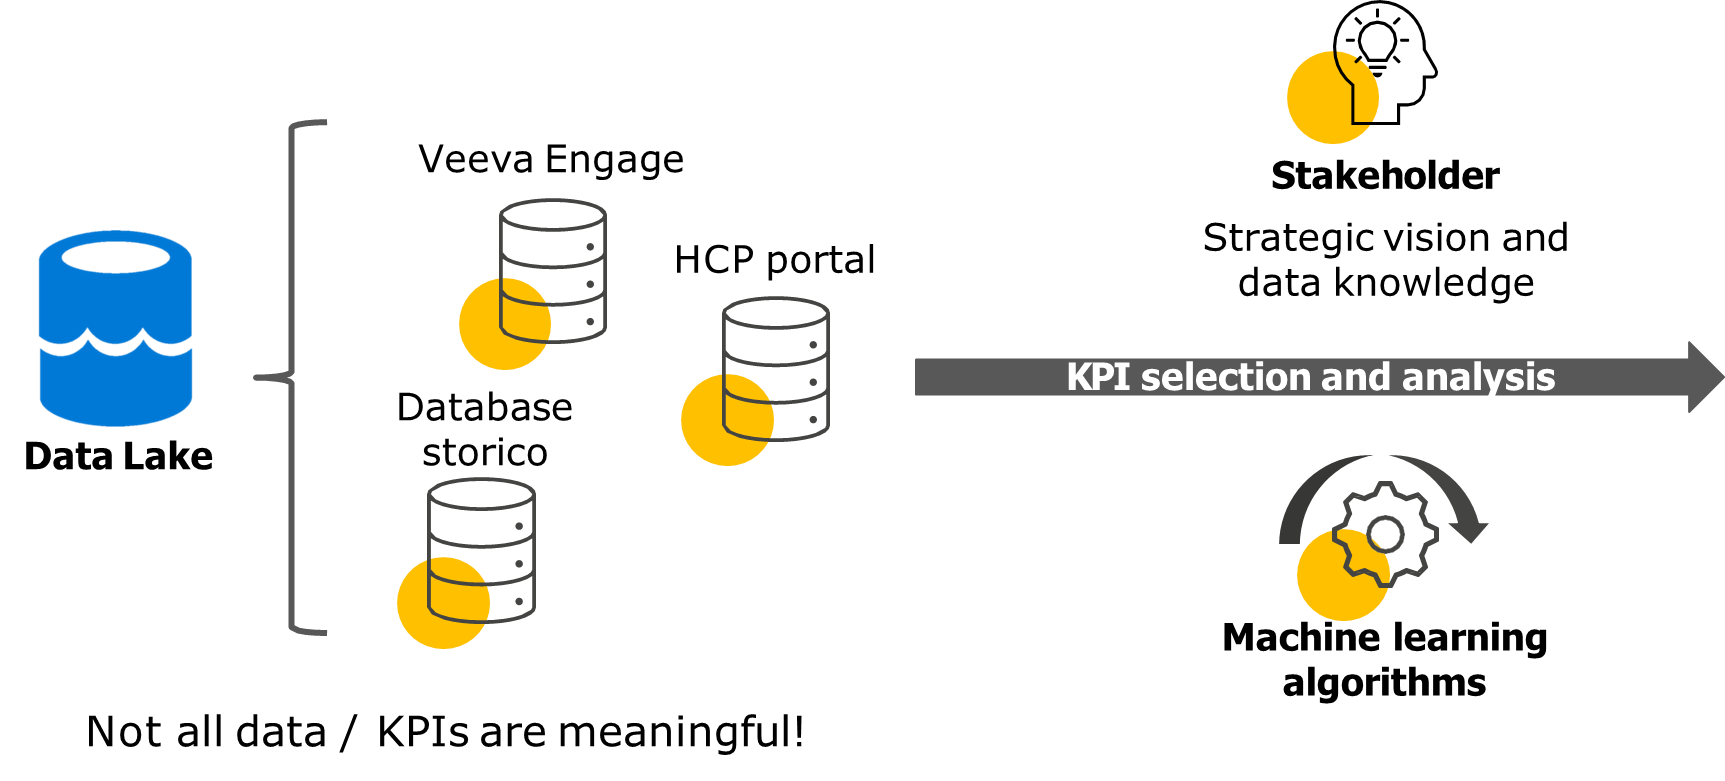
The process began with gathering data from the company’s “data lake,” which contained vast amounts of information such as email interaction statistics (open rates, click-through rates), data from the HCP portal, and historical records of visits. The challenge here was not just to aggregate this data, but to select relevant variables and apply appropriate analytical techniques, such as machine learning or statistical algorithms, to classify the customer base effectively. Rather than segmenting the data annually, the team chose to apply the same segmentation model over multiple years, ensuring that the resulting customer segments could be tracked over time and revealing how clinicians’ behaviors evolved from year to year, including the impacts of external factors like the COVID-19 pandemic.
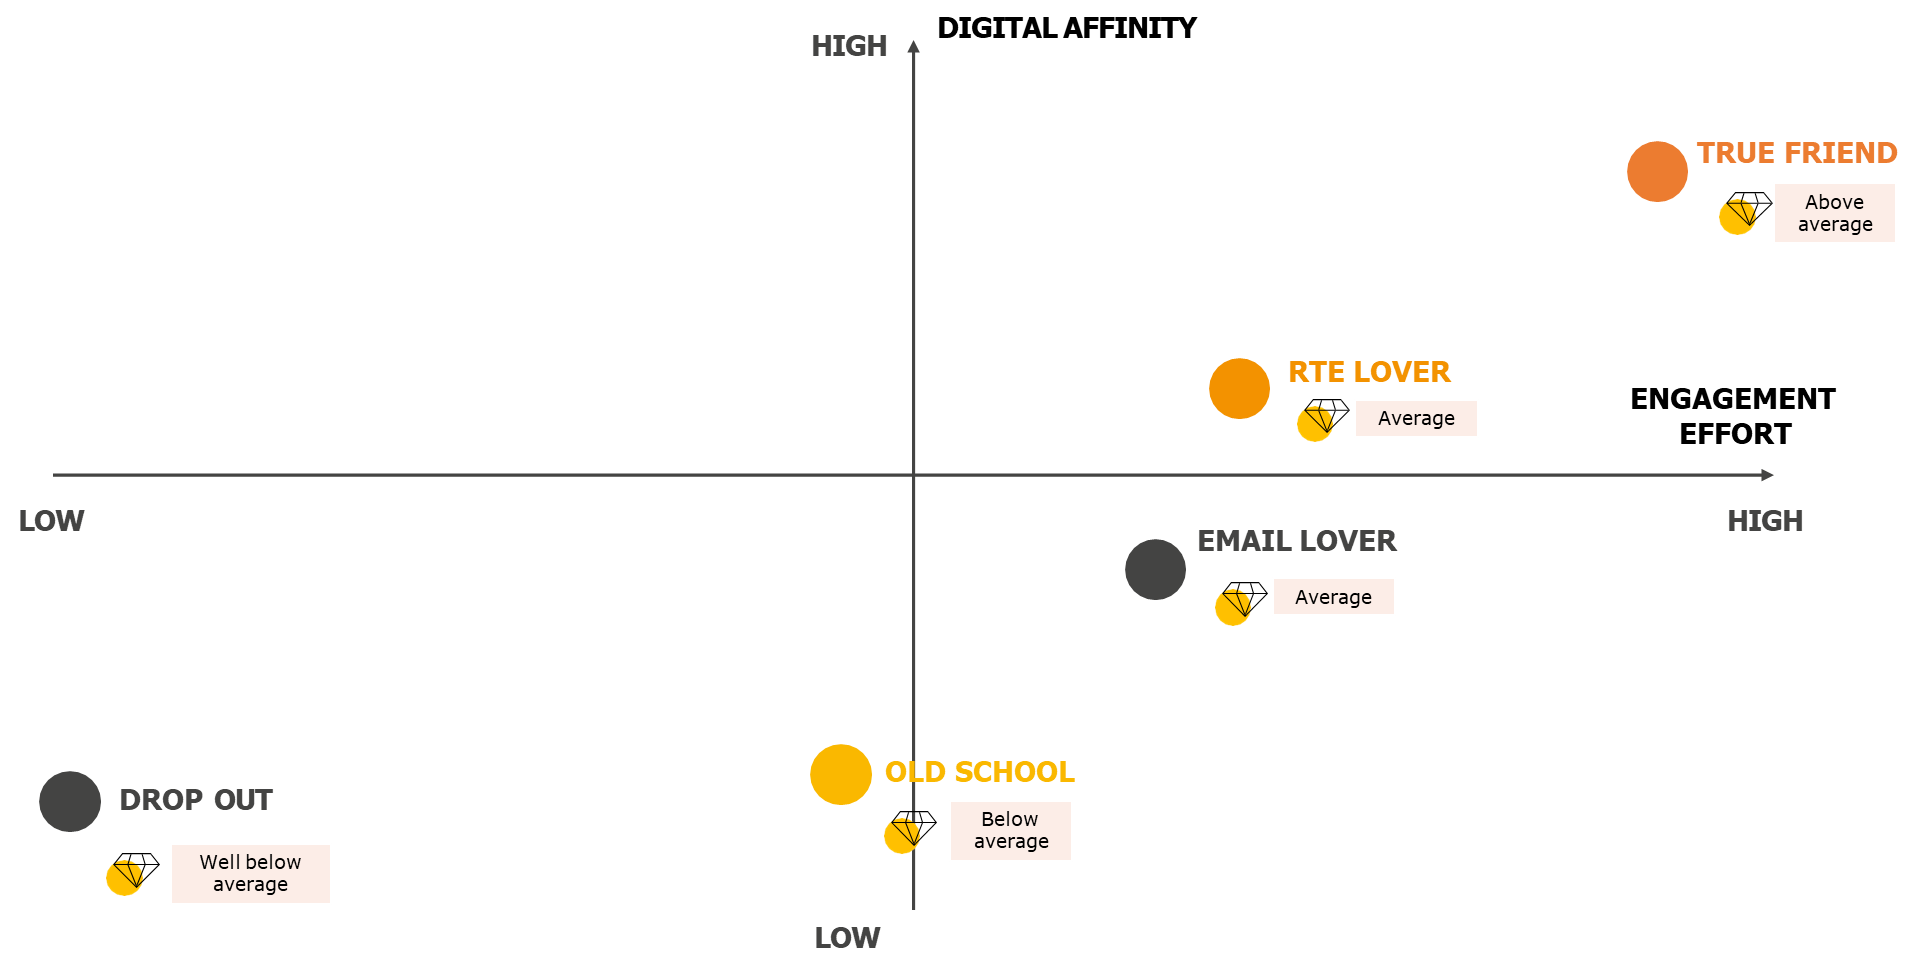
A key aspect of this project was the mapping of these clusters. By applying relevant variables—such as digital affinity and engagement effort—a map was created to position different customer clusters based on these factors. For instance, one segment identified in this analysis was a group characterized by very low digital engagement and minimal interaction with the company. These were classified as “drop-out” customers, as they showed little interest in digital channels and were largely unresponsive to engagement efforts. On the other end of the spectrum, the “true friend” segment displayed high digital affinity and high engagement, representing clinicians who were responsive to digital content and whose interactions with the company were largely cost-effective.
The most interesting and actionable part of this segmentation process was the identification of the “true friends.” These were clinicians who not only demonstrated strong digital engagement but also had high responsiveness to the company’s outreach efforts. Importantly, these customers had high email open rates and were receptive to various digital forms of communication, such as scientific content delivered through emails or the HCP portal. Since these clinicians required fewer in-person visits and were more open to digital communication, they represented a high-value segment for the company.
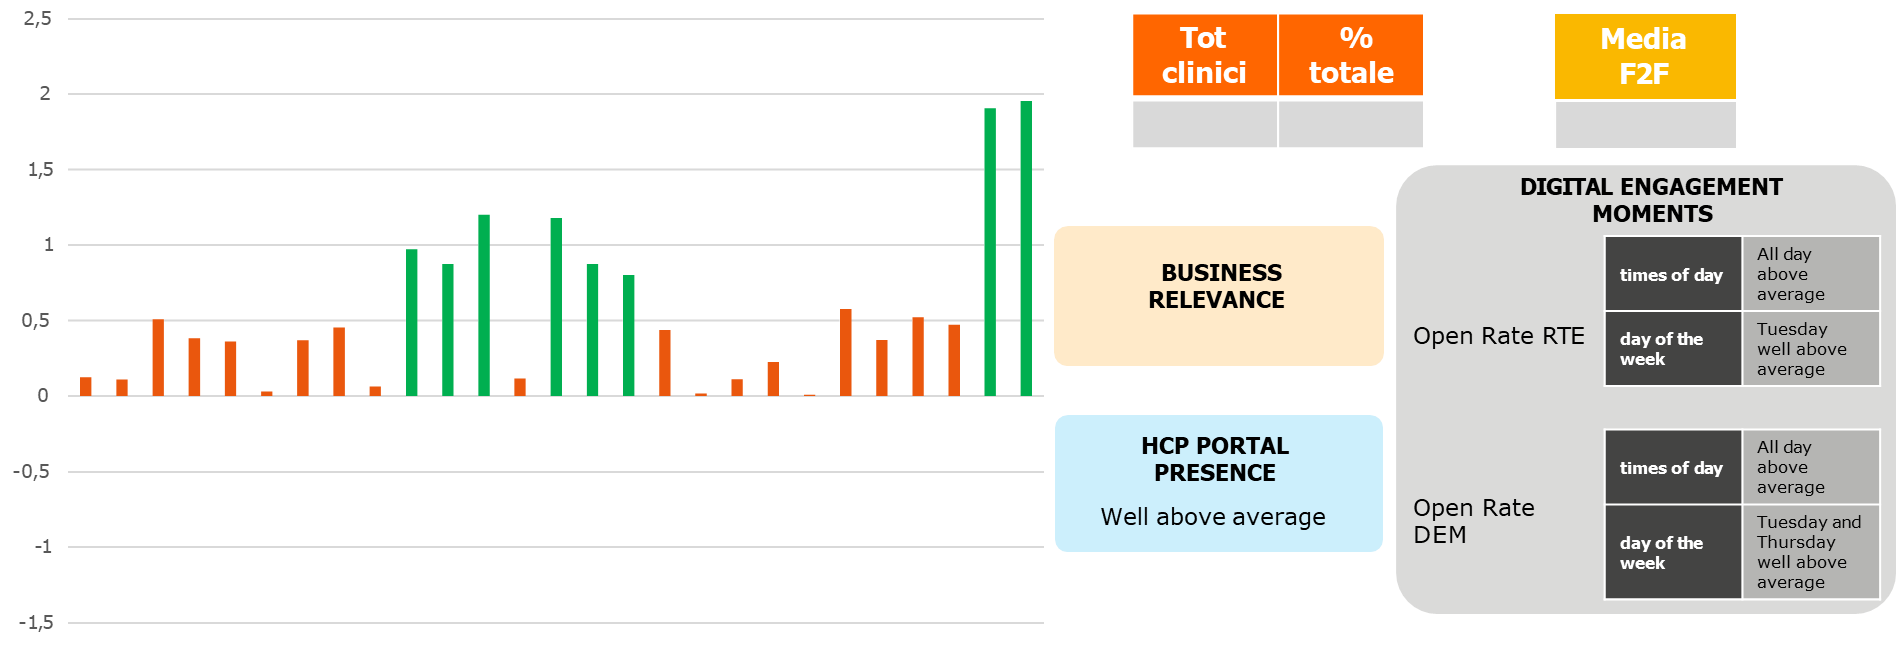
The segmentation process also involved calculating the distance from centroids in the data space. This helped to highlight the variables that most strongly differentiated each segment. For the “true friend” cluster, these variables indicated that the clinicians in this group were highly engaged and receptive, making them prime candidates for targeted engagement efforts. The analysis showed that these clinicians had above-average interaction rates, both in terms of email open rates and engagement with the company’s digital content. This is an important insight because it allows the company to allocate resources more effectively, focusing their efforts on the segments with the highest potential return on investment.
Case Study: Volley
The case of “Volley” revolves around the segmentation of a diverse audience for an Italian sports consortium that manages both men’s and women’s volleyball teams. These teams are highly competitive, participating at the top levels of Italy’s national leagues. The audience they cater to is multi-faceted, including not only passionate fans but also families, schools, and corporate sponsors, all of which engage with the organization in different ways. Additionally, the consortium invests significantly in youth academies and community programs, making their portfolio of activities expansive. Their focus on these various stakeholders adds a layer of complexity to their segmentation needs, as it is crucial to understand and engage with each group differently.
A significant challenge the consortium faced, like many modern organizations, was the abundance of data generated from multiple touchpoints. These touchpoints spanned both digital and non-digital channels. While this data had the potential to offer valuable insights, it was essentially untapped and unstructured, offering little utility without proper analysis and segmentation. At the time, the organization lacked a sophisticated segmentation model that could be used to drive marketing and engagement strategies effectively.
The goal of the segmentation project was to create a more targeted approach based on key behavioral variables, such as price sensitivity, purchase behavior, and responsiveness to promotional emails. This segmentation strategy was based on principles similar to Recency, Frequency, and Monetary (RFM) models, but it evolved to include more nuanced data related to consumer purchasing patterns and their interactions with the brand. Essentially, the team sought to identify and segment different types of customers by their purchasing behavior, rather than simply relying on demographic information.
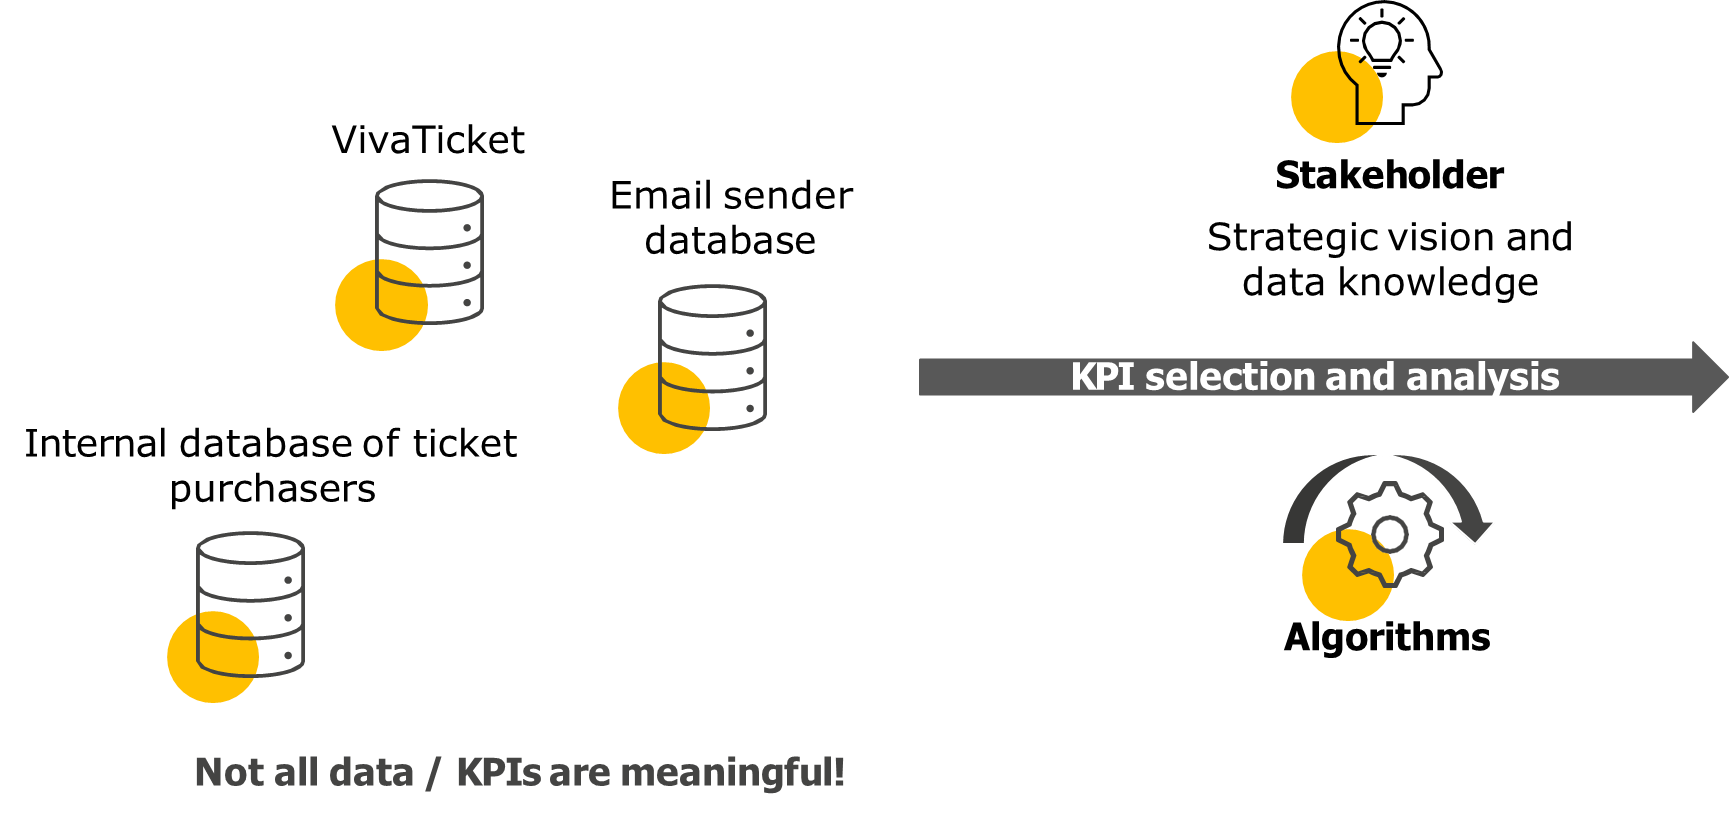
To implement this, the consortium utilized data from several sources, including an email marketing platform, a ticket sales database, and an internal CRM system. These sources provided a rich set of data on consumer behaviors, such as purchase frequency, email open rates, and interaction with promotional content. The data was first aggregated, and then machine learning algorithms, specifically the K-means clustering technique, were applied to identify distinct consumer segments. This approach allowed the team to capture patterns of behavior in the most recent season and map them to previous seasons, effectively creating a longitudinal view of customer behaviors over time.
However, as with many data-driven initiatives, challenges arose during the segmentation process. The elbow method, which is often used to determine the optimal number of clusters in K-means clustering, failed to provide a clear solution. This was primarily because the data sets—purchase behaviors and email marketing data—were analyzed separately and then combined, which led to complications in identifying a distinct point for cluster determination. In this case, the elbow method did not yield a satisfactory result, so the team had to rely on a more pragmatic approach, balancing between the number of clusters that were manageable for the organization and the ability to extract meaningful insights.
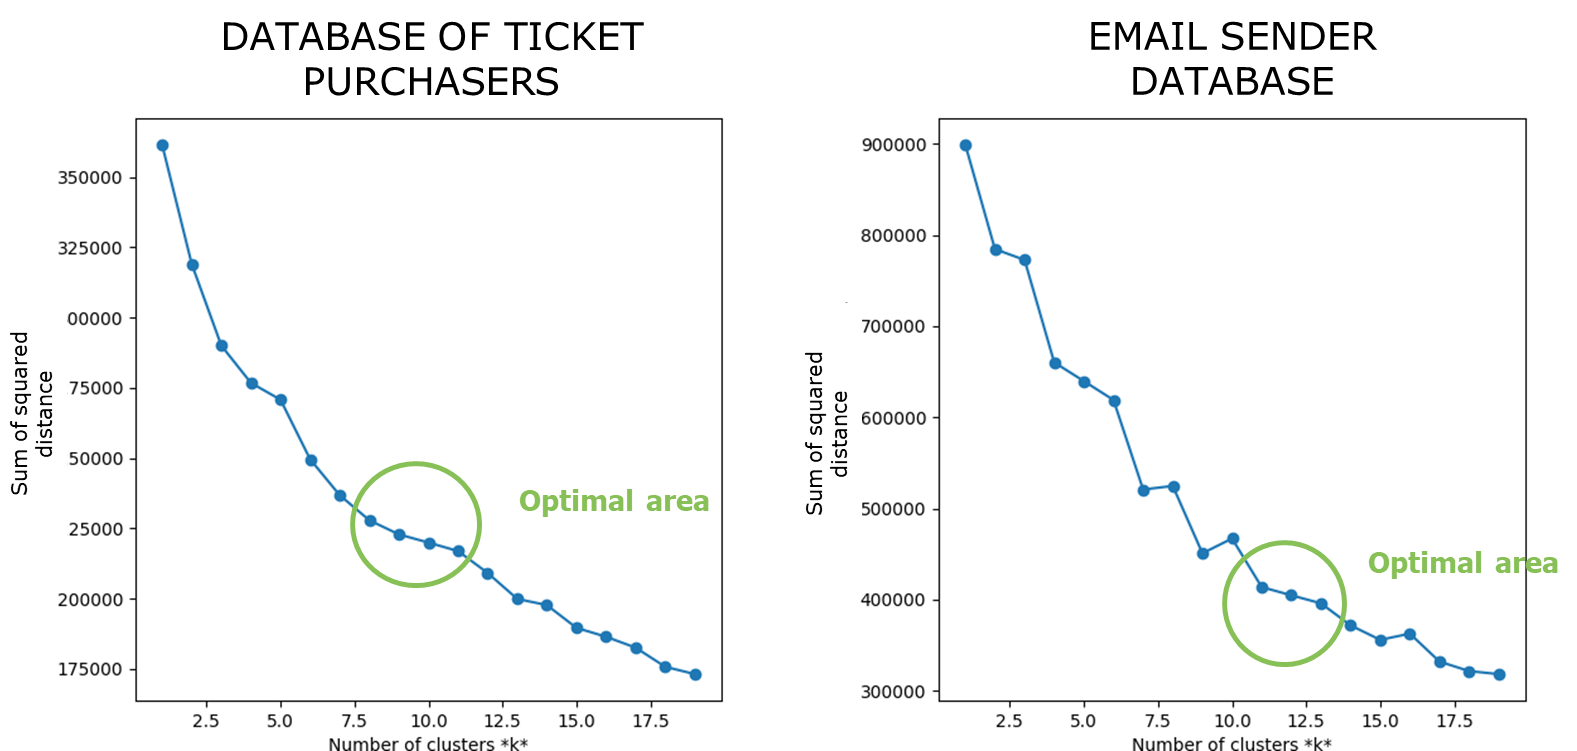
To handle this complexity, the segmentation process was refined by selecting one set of data (ticket purchases) as the reference point for the segmentation model. The remaining data from email marketing interactions was used to enrich the segmentation, but it was not included directly in the clustering process. This strategy allowed for a more streamlined and actionable segmentation framework that could be operationalized in marketing campaigns. By focusing on the ticket purchase data and enhancing it with additional insights from email engagement, the team created a more robust and useful model for customer profiling.
The segmentation revealed a variety of clusters with distinct behaviors. One such cluster was composed of customers who purchased high-value tickets but did so infrequently. These customers were identified as “Nike Expanding,” as they tended to attend only specific, high-profile matches. This segment exhibited a clear preference for premium tickets but did not purchase tickets regularly. Another interesting segment was the “Free Riders,” who made frequent purchases but typically opted for low-cost tickets. These individuals were highly responsive to promotions and could be targeted with discount offers. However, from a business perspective, this cluster represented a challenge, as they tended to buy only when discounts were available, leading to a lower average spend.
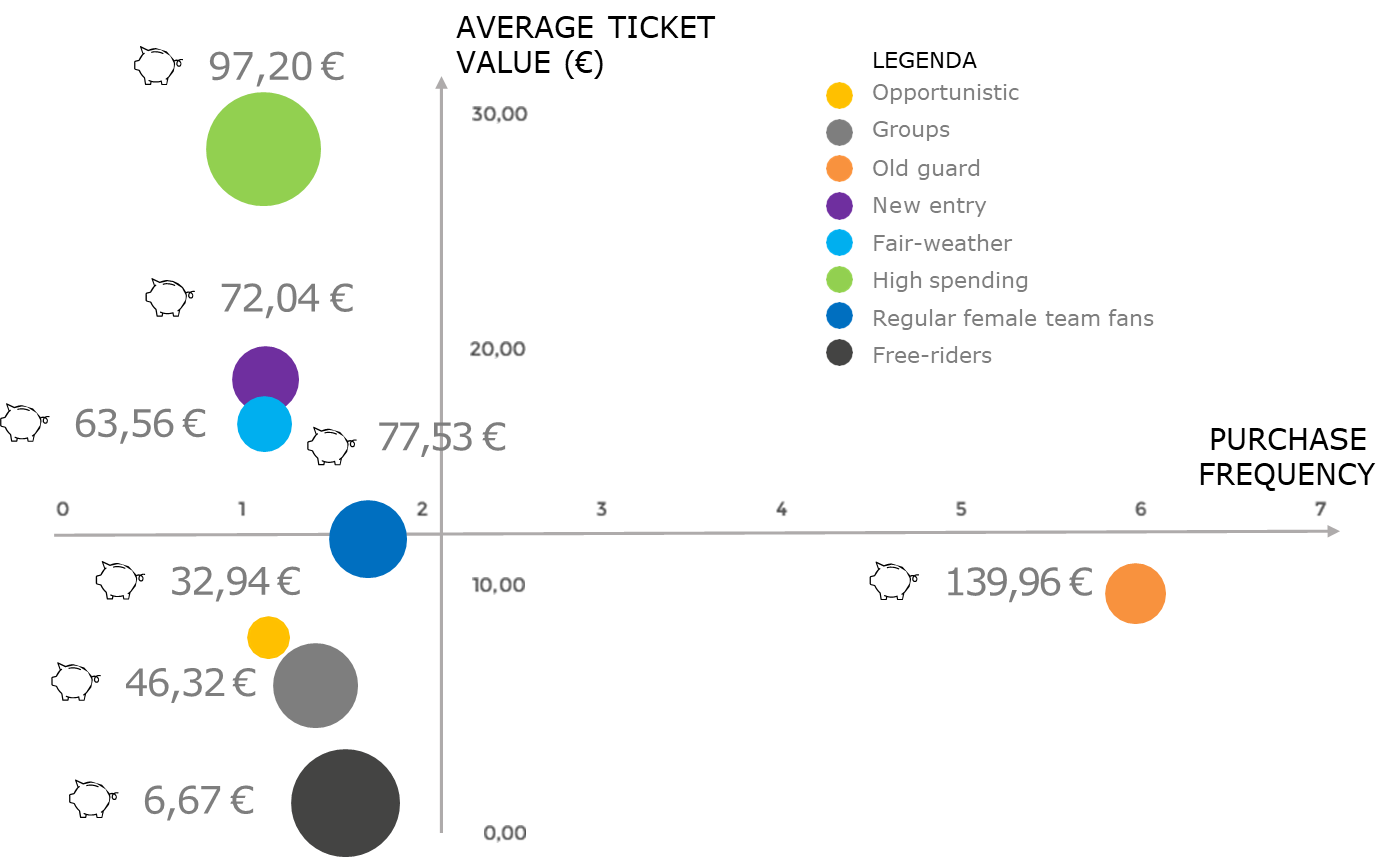
The segmentation also identified other clusters based on specific behaviors, such as those who only attended women’s volleyball matches, and various patterns of ticket purchasing across different demographics. The richness of these insights allowed the consortium to tailor its marketing efforts more precisely. For example, the “Nike Expanding” cluster required communications that emphasized premium experiences, as they were less price-sensitive but more selective about when and where they attended matches. Conversely, the “Free Riders” cluster could be targeted with specific promotional offers, but marketing strategies had to account for their tendency to only engage when discounts were available.
By profiling and understanding these clusters, the organization could optimize its marketing efforts, focusing on high-value segments while also managing less profitable ones more effectively. This segmentation not only helped in targeting the right audience with the right message but also allowed for the strategic allocation of resources. In practice, this meant that certain high-value customers could be nurtured with personalized, high-touch communication, while more cost-sensitive segments could receive promotional content designed to drive conversions without negatively impacting profitability.
| Category | Details |
|---|---|
| SOCIO-DEMOGRAPHIC | There is a higher concentration of women, and the slightly more represented age ranges are: under 18, 19–24, 25– 30, 30–40, and 60–75. They predominantly reside in the provinces of Lecco, Como, Bergamo, and Brescia. |
| FAN TYPE | On average, they are female team fans, more than average (64% of tickets). |
| PARTICIPATION | They attend only selected matches. They are below average in number of tickets purchased (3.54), number oftransactions (1.41), and number of matches attended during the season (1.32).. |
| TICKET VALUE | They purchase the most expensive tickets of all clusters, above average both in revenue per ticket (€28.63) and per match (€75.82). This is due to almost exclusively purchasing tickets above €20 (95%), mostly at full price (84%). |
| PURCHASE TIMING | They buy tickets well in advance, with a much higher than average rate of purchases made 4 to 7 days before the match (75%). |
| PURCHASE MOMENTS | They do not show peculiar behaviors compared to the average in terms of purchase moment (weekend vs. weekdays) and generally buy more often during the weekend (71%). |
| TICKET TYPE | They are above average in gold ticket purchases (44%), but especially in platinum (54%). |
| ARENA SECTION | They frequently choose the red stand / first ring (86%), much higher than the average. |
| EMAIL MARKETING BEHAVIOR | They have a neutral behavior regarding emails, both in open and click rates, with no specific differences across the days of the week. There’s a preference for opening emails in the evening (66%), but not markedly above average. They interact less with marketing-type emails than the average (Marketing OR = 29%, CTR = 2%) and freebie emails (Freebie OR = 23%, CTR = 2%). |
