Sector, Industry, Customer, and Business Users
To understand the project’s environment, we must first establish the context, encompassing the project’s history, the customer, and the business users who acted as stakeholders. This foundation is crucial for grasping the project’s goals and constraints.
Differentiating Sector and Industry
The terms “sector” and “industry” are often used interchangeably, but they represent distinct levels of economic classification.
Definition
- A sector refers to a broad segment of the economy, encompassing a wide range of related activities. It serves as an overarching category, grouping businesses with similar functions or characteristics.
- An industry, on the other hand, is a more granular classification within a sector. It represents a specific group of companies that share common operations, business activities, and often compete within the same market for similar products or services.
For instance, the financial sector includes diverse activities such as banking, insurance, and investment management. These activities, while related, operate within distinct industries. In the financial sector, banking and insurance are distinct industries, each with its own set of operational characteristics, regulatory frameworks, and competitive dynamics.
The importance of distinguishing between sectors and industries lies in the need for meaningful comparisons. When analyzing business performance, financial metrics, or investment opportunities, it is essential to compare entities within the same industry. Comparing companies across different industries within the same sector can lead to misleading conclusions, as their operational models, market dynamics, and regulatory environments may differ significantly.
Companies within the same industry typically share common production processes, similar outputs, and face similar regulatory constraints. This shared environment facilitates meaningful benchmarking and analysis.
Consumer Goods Sector
Our primary focus is the consumer goods sector, a segment of the economy that produces final products intended for direct consumption by individuals. This sector’s proximity to everyday life, through products found in supermarkets and retail stores, makes it a relevant and accessible area of study.
Two key differentiators characterize the consumer goods sector:
- Consumer Behavior Impact: The performance of companies within this sector is highly sensitive to consumer behavior. Shifts in consumer preferences, purchasing power, and lifestyle trends can significantly impact demand and sales. This sensitivity underscores the importance of marketing and consumer research in this sector. During economic growth, consumer spending tends to increase, benefiting the consumer goods sector. Conversely, economic downturns often lead to a reduction in discretionary spending, impacting demand for non-essential goods.
- Marketing and Brand Differentiation: Competition within the consumer goods sector is often intense, with numerous companies offering similar products. Marketing, advertising, and brand differentiation are critical for gaining a competitive edge. Companies invest heavily in building brand recognition, developing innovative products, and implementing effective marketing strategies to attract and retain customers.
Consumer Packaged Goods (CPG)
Within the consumer goods sector, we further narrow our focus to consumer packaged goods (CPG). CPG products are characterized by their packaged nature and are typically non-durable, intended for rapid consumption.
CPG products can be categorized based on:
- Product Categories: Common categories include packaged foods, beverages, and personal care products.
- Product Nature: Products can be classified as durable or non-durable. Durable goods, such as electronics, have a longer lifespan, while non-durable goods, such as food and beverages, are intended for immediate or short-term consumption. CPG primarily focuses on non-durable goods.
CPG companies generate vast amounts of data due to the high volume of small transactions associated with their products. This data reflects the rapid turnover and short shelf life of CPG products. The data from CPG tends to be very high in volume, and often has a high velocity. This is due to the large number of sales transactions, and the large number of Stock Keeping Units (SKU’s) that are sold. The data is also very diverse, containing things such as sales data, inventory data, and customer data.
Customer in the Alcoholic Beverage Industry
The focus of today’s analysis is on a company operating within the alcoholic beverage industry, a sector that commands a significant share of the global consumer goods market. The market for alcoholic beverages is substantial, with an estimated worth in the range of one trillion dollars as of 2023. Contrary to expectations, the industry demonstrated remarkable stability even during the COVID-19 pandemic, with minimal decline in demand. This resilience is attributed to the continuous consumer demand for alcoholic products and the adaptability of businesses in diversifying distribution channels, including online sales and retail partnerships.
Within this industry, alcoholic beverages are classified into various categories based on their composition, alcohol content, and target consumer base. These categories include wine, beer, spirits, and liqueurs, each catering to distinct demographics and consumption habits. For example, the consumer profile of wine enthusiasts differs significantly from that of beer consumers or whiskey aficionados, not only in terms of product preference but also in purchasing behavior, consumption patterns, and brand loyalty.
Key Market Players and Industry Dynamics
The alcoholic beverage industry is characterized by a complex interplay of market trends, consumer preferences, and regulatory constraints. Given that alcohol consumption is heavily regulated worldwide, companies operating in this sector must navigate a diverse legal landscape, as regulations governing production, distribution, and sales vary significantly across different regions. Compliance with local and international laws, including taxation policies, labeling requirements, and distribution restrictions, poses a critical challenge for global brands.
The market is predominantly dominated by a few multinational conglomerates that own a vast portfolio of brands. These corporations strategically expand their market presence through both organic growth and acquisitions of smaller brands to diversify their product offerings and penetrate new market segments. Some of the most influential players in the industry include:
- Diageo: Recognized as the global leader in alcoholic beverages, with a strong emphasis on premium and super-premium spirits. Some of its most renowned brands include Johnnie Walker, Baileys, and Tanqueray.
- Pernod Ricard: A European powerhouse with a diverse portfolio of brands such as Absolut Vodka, Chivas Regal, and Jameson Irish Whiskey. Its strength lies in the strategic differentiation of products to cater to various consumer preferences.
- Campari Group: A major Italian player headquartered in Milan, managing brands such as Aperol, Campari, and Wild Turkey. The group has significantly expanded its market influence through acquisitions, including control over premium champagne labels.
- Heineken and AB InBev: These conglomerates primarily focus on beer production and own hundreds of beer brands worldwide, including popular labels like Heineken, Budweiser, and Stella Artois.
Market Structure and Data Analytics
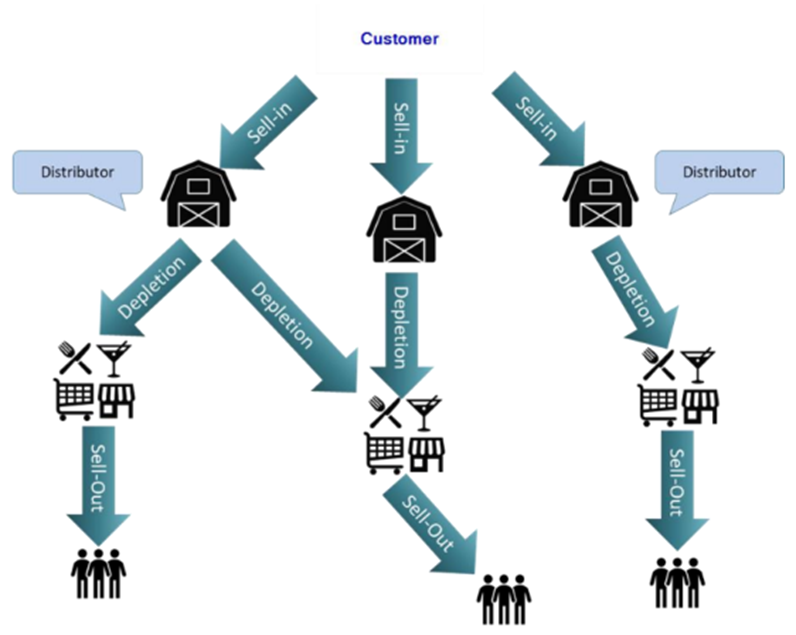
To understand how companies in this sector structure their market approach, it is essential to examine the three-tier sales model that governs product distribution. The flow of goods from production to the end consumer involves distinct stages:
- Sell-In (First-Tier Distribution): The manufacturer sells products directly to distributors. This stage is recorded in the company’s Enterprise Resource Planning (ERP) system, ensuring complete ownership and tracking of transaction data. The ERP system enables businesses to manage inventory, logistics, and revenue streams efficiently.
- Depletion (Second-Tier Distribution): At this stage, the distributor sells the products to retailers, including supermarkets, restaurants, hotels, and bars. Companies lose direct visibility over their products once they leave the distributor’s inventory, making external data acquisition necessary to track sales performance.
- Sell-Out (Third-Tier Sales to Consumers): This final step involves retailers selling directly to end consumers. Data on sell-out transactions is critical for understanding consumer preferences, but companies rely on third-party data providers to obtain insights into this segment. These providers aggregate sales data from various retail locations and offer it as a market intelligence service.
Challenges in Data Acquisition and Analysis
Unlike sell-in transactions, where the company has full ownership of data, depletion and sell-out data require businesses to purchase information from external sources. These data providers collect and analyze retail sales data across multiple locations, allowing companies to:
- Monitor market trends and consumer demand across different regions.
- Optimize inventory management and distribution strategies to prevent overstocking or shortages.
- Refine marketing campaigns by analyzing product performance and customer engagement metrics.
However, companies can typically access only aggregated industry data rather than specific competitor insights. This limitation necessitates the development of predictive analytics models that estimate demand based on historical trends, pricing strategies, and external factors such as economic conditions and seasonal variations.
Data Management and Automation
In the context of data integration, automation plays a crucial role in minimizing human errors and improving efficiency. One of the primary motivations for automating this process is the significant number of errors commonly encountered in manually managed Excel files. The traditional approach, which required extensive manual input and verification, often led to inconsistencies, data mismatches, and inefficiencies.
The goal of this project was to transform a process that typically took weeks or even months into a streamlined workflow that could generate results almost instantaneously.
One of the central challenges in this endeavor was data harmonization. This involved ensuring that different dimensions and price-per-item (PPI) values from various providers could be standardized and made compatible with each other. Without a unified framework, data from different providers would remain fragmented and difficult to interpret.
Standardization also allowed for greater leverage in negotiations with data providers. With a globally accepted data template in place, customers could demand compliance from vendors, ensuring that all incoming data adhered to a predefined structure. This approach shifted the power dynamics, enabling the customer to enforce data consistency and quality across the entire ecosystem.
Data quality was another critical aspect of this initiative. The well-known principle of “garbage in, garbage out” highlights that even the most sophisticated analytical tools and dashboards are rendered useless if the underlying data is inaccurate or inconsistent. Establishing rigorous data validation mechanisms was essential to ensuring that the processed data was accurate and reliable.
Another significant challenge was data visualization. Different stakeholders required access to the data but had vastly different needs. Two main categories of users were identified:
- Global Executives: Focused on high-level insights and trends for strategic decisions.
- Operational Analysts: Needed detailed, product-level data for daily operations.
To implement the project, four key stages were followed:
- Global Data Template: Business analysts standardized data formats from multiple providers into a unified model.
- Data Architecture: Data architects integrated external data into the existing system and mapped data flows.
- UX/UI Design: Tailored dashboards for executives (mobile-friendly) and analysts (detailed desktop views).
- Project Rollout: Phased implementation, starting with pilots in smaller markets before global deployment.
Technical Complexity and Data Modeling
At the core of this initiative was the challenge of integrating diverse data sources into a cohesive model. One of the primary difficulties lay in reconciling inconsistencies in the way data was structured across different providers.
For instance, geographical data posed a significant challenge. Some providers categorized their data by country, while others used regions, provinces, or even continents. Ensuring that these varying classifications could be aligned was crucial for accurate analysis. Similarly, key performance indicators (KPIs) were tracked differently by different providers, leading to discrepancies in how metrics were measured and reported.
Another complexity arose from differences in time periods. Not all companies follow the same calendar system internally. Some organizations use a 4-4-5 calendar, while others use 4-5-4 or other fiscal calendars that do not align with the standard Gregorian calendar. These variations made it difficult to perform year-over-year comparisons.
Product categorization was another major challenge. The same product could be labeled differently across different datasets, requiring an extensive data-matching process to ensure uniformity. Additionally, financial data often arrived in different currencies. Some providers sent data in their local currency, while others pre-converted it into a standard currency, sometimes using inconsistent exchange rates.
Measurement units also varied across datasets. Some providers reported quantities in liters, while others used different volume measurements. Furthermore, the United States and the United Kingdom have distinct measurement systems, adding another layer of complexity.
Data Model and Schema Design
The final step in the integration process was structuring the data into a relational model that could be efficiently queried and analyzed. The project adopted a star schema architecture, a widely used data warehouse modeling approach that enhances query performance.
At the center of the schema was the fact table, which contained transactional data and key performance metrics. Surrounding this fact table were dimension tables, each containing reference data that provided context to the facts. The main dimensions included:
- Product Dimension: Standardized product descriptions, categories, and attributes.
- Geography Dimension: Standardized geographical classifications, ensuring consistency across country, region, and province-level data.
- Time Dimension: Unified calendar structure, allowing for proper time-based comparisons.
Data Architecture and Process Flow
The data architecture supporting this project is designed to handle large-scale ingestion, validation, and visualization of data from multiple providers. The core infrastructure is based on SFTP servers, which act as the primary data sources. The architecture is responsible for extracting raw data from these sources, processing it through different stages of transformation, and ultimately visualizing it using Power BI.
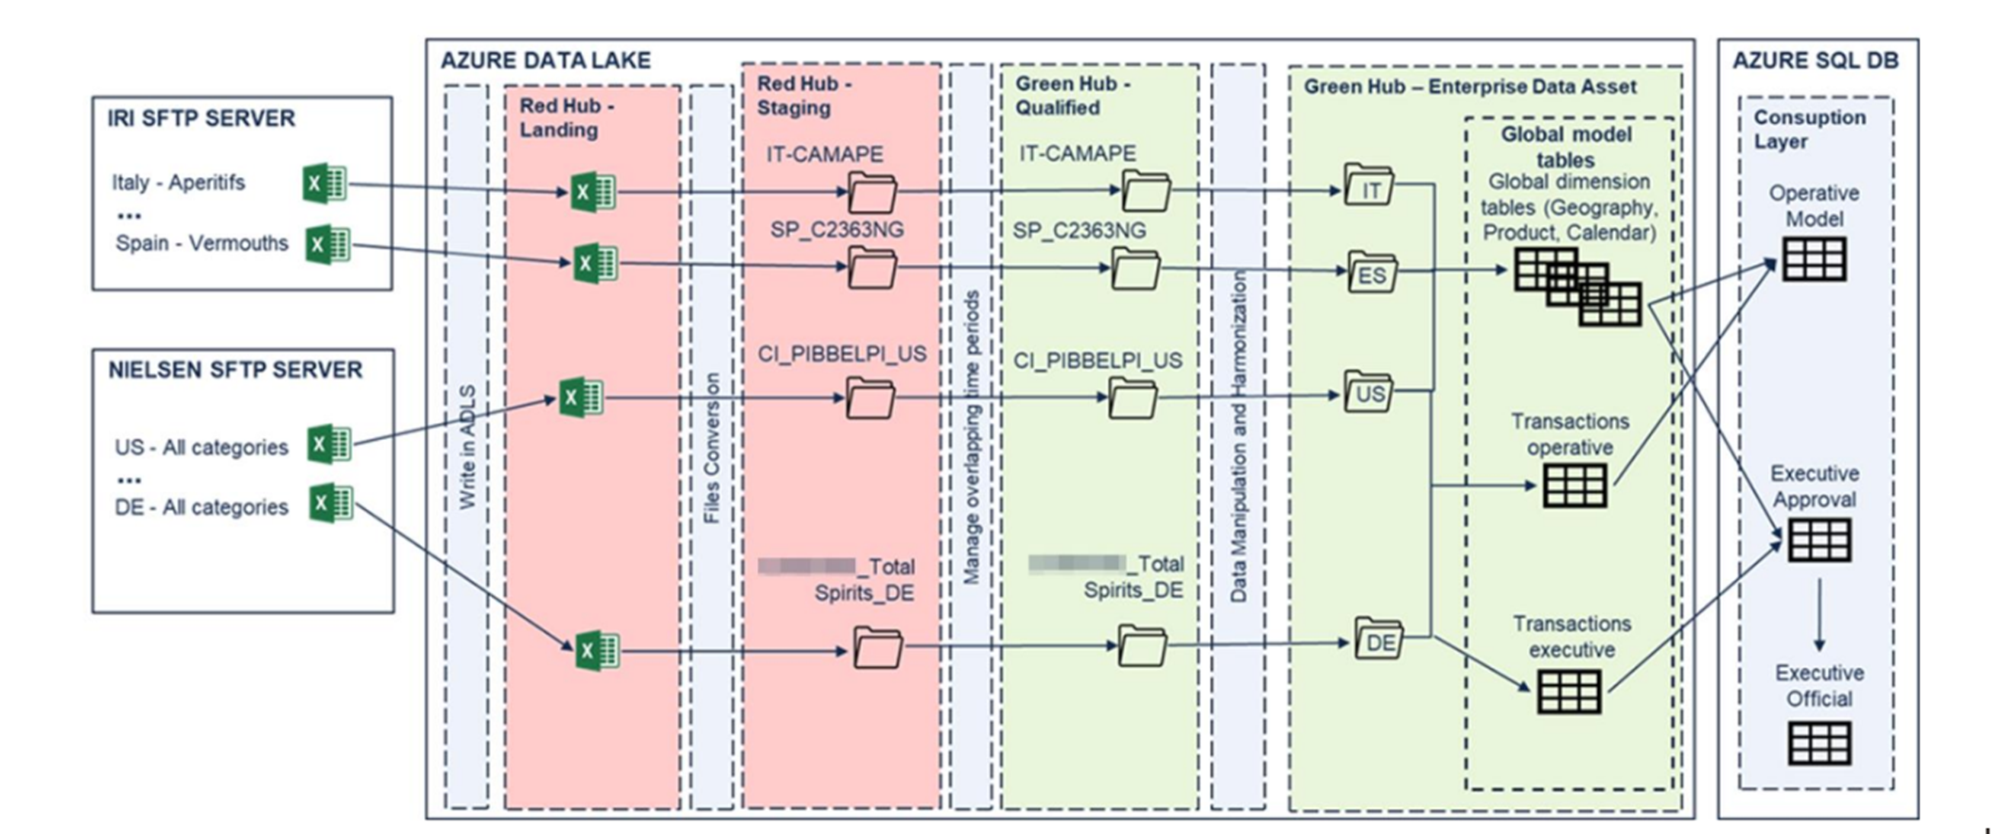
The architectural pipeline follows a structured approach, comprising multiple layers:
- Bronze Layer: This stage represents the raw, unprocessed data as it is ingested directly from the providers.
- Silver Layer: In this intermediate stage, data undergoes cleaning, transformation, and harmonization, ensuring consistency across sources.
- Gold Layer (Final Tables): This is where the data is stored in an optimized format, making it ready for visualization and reporting via Power BI.
Once the data is processed through these layers, it is structured into well-defined tables that support various reporting needs, allowing stakeholders to access high-level insights or drill down into granular details as required.
High-Level Data Processing and Approval Workflow
When raw data arrives from the providers, it must go through a rigorous transformation and validation process before it can be incorporated into the official reports. The initial transformation involves loading the data into what is known as the Approval Model, a staging area where data inconsistencies and anomalies can be identified.
At this stage, a Power BI approval report is generated, enabling users to assess data quality. A common issue encountered is extreme deviations in reported values. Such anomalies often indicate errors in provider submissions, such as misplaced decimal points or additional zeroes in numerical values.
To mitigate these errors, an approval mechanism was established, allowing users in each country to either approve or reject the incoming data. If discrepancies are detected, the provider is notified, and the incorrect data is excluded from the next processing stage. Once data is validated and approved, it is moved into the Official Model, where it is stored as a definitive dataset for reporting and analysis.
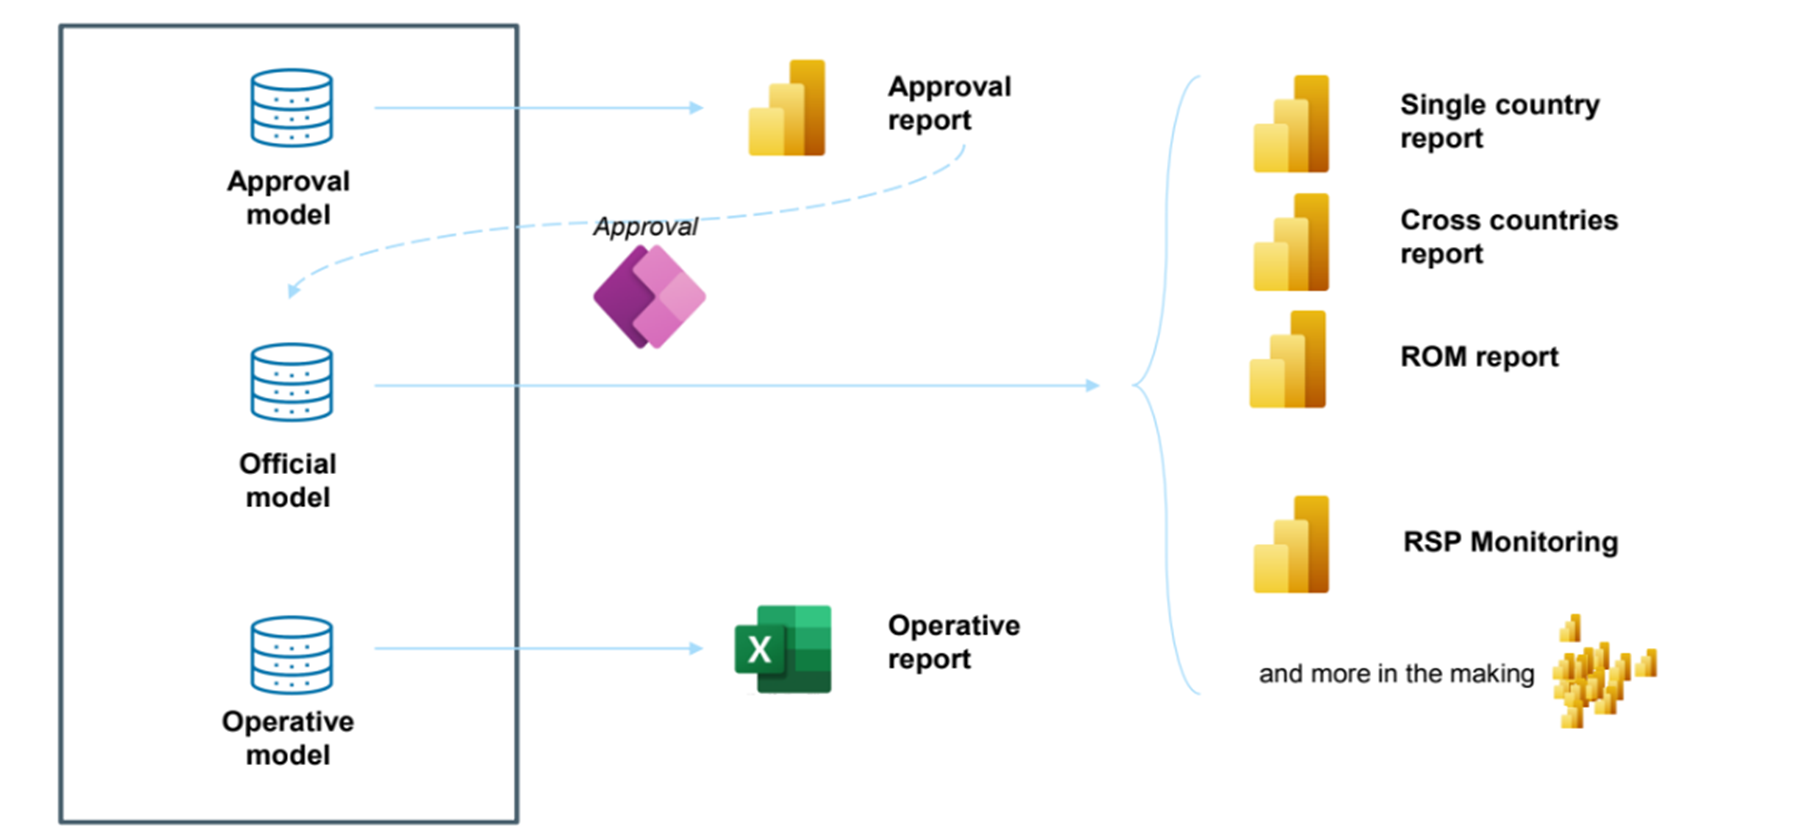
The approved data is then distributed across different types of reports:
- High-Level Reports: These offer aggregated insights, such as market trends and cross-country analysis. They focus on broad indicators rather than detailed transactional data.
- Operational Reports: These provide a detailed breakdown of data at the country level, enabling deep analytical exploration by regional analysts.
- Granular Data Access: In cases where full granularity is required, users can interact with the data through an Excel Pivot Table, directly connected to the Operational Model in Power BI. This allows users to perform custom analyses using familiar Excel functionalities without compromising data integrity.
One key advantage of Power BI’s semantic model is that it acts as a centralized data artifact, meaning that the same dataset can be visualized in multiple formats, whether through Power BI reports or Excel-based queries. The consistency of the semantic model ensures that all stakeholders are working with the same data definitions and metrics, eliminating discrepancies across reporting tools.
Automation and Approval System Using Power Apps
To further enhance efficiency, an automated data approval application was developed using Microsoft Power Apps. This application provides an interface for users to validate and approve data within a structured workflow.
Power Apps is part of the broader Microsoft Power Platform, integrating seamlessly with Power BI, Azure Data Factory, and other tools to create a cohesive data governance system. The application was designed using a combination of:
- Power BI for data visualization
- Power Automate for process automation
- Azure Data Factory for data movement and transformation
- Outlook and Excel integration for communication and external review
The approval system is structured around two main user roles:
- Local Users (Country-Specific Approvers): These users are responsible for validating data at a country level. Their access is restricted so that they only see data relevant to their respective regions. This segmentation is handled natively within Microsoft’s security framework, ensuring that a single Power BI report can dynamically adjust visibility based on the user’s role and location.
- Global Users (Super Approvers): Once local users have validated and approved their country-specific data, global users have the authority to finalize approvals and trigger the data transfer to the Official Model. This final step ensures that only vetted and high-quality data is used for official business intelligence reporting.
Data Visualization and Agile Implementation
Data visualization plays a critical role in understanding market trends, monitoring business performance, and making data-driven decisions. One of the key aspects of this process is ensuring that the data structure remains aligned with evolving business needs. This requires continuous validation through numeric checks, which help identify new products that require mapping to existing categories in the report. Additionally, document analysis and Power BI reports provide an overarching view of the market landscape, including market share trends, brand positioning, and performance metrics across different regions.
A crucial aspect of business intelligence reporting is tracking Recommended Selling Price (RSP), that allows companies to monitor the final market price of their products, gaining insights into how much distributors and retailers charge consumers. By analyzing price trends, businesses can assess their competitive positioning within the market.
One of the primary tools for these analyses is a cross-country Power BI dashboard, which provides an interactive visualization of data across multiple markets. The dashboard includes several filtering options that allow users to segment data by different parameters. On the right side of the dashboard, customer performance metrics are displayed, highlighting top brands by sales and the top ten brands with the highest growth rates. On the left side, sales volumes and average prices are compared across different countries using bubble charts, providing a clear representation of market trends. At the bottom, price percentage changes are visualized in relation to the overall market price fluctuations, enabling businesses to track how their products align with industry-wide changes.
Incremental Development
In an agile development environment, the primary objective is to deliver continuous value to stakeholders. Agile methodologies emphasize iterative progress, where new features and improvements are delivered in small, incremental steps rather than waiting for a full, end-to-end solution to be completed.
If an organization were to follow a traditional, non-agile approach, it would involve building the entire data architecture first, integrating data from all available sources, ensuring compliance, gaining user approvals, and only then creating dashboards and reports for end users. In such a scenario, the value is only realized at the end of a long development cycle, making the process inefficient and delaying actionable insights.
An agile approach, on the other hand, would prioritize early and incremental delivery of data insights. For example, the project could begin with a pilot implementation for a single country, ensuring that the entire pipeline—from data ingestion to architecture, integration, and visualization—is functional within that specific scope. While the initial version may not be perfect, it provides immediate value by allowing users to access and analyze data.
In subsequent sprints, the solution can be expanded and refined. With each sprint, the solution evolves while continuously delivering value. This approach ensures that from the very beginning, stakeholders have access to usable insights, enabling them to make data-driven decisions without waiting for the entire system to be fully developed.
Goal Achieved
The completion of the project marked a significant achievement in building a fully automated data management system that handles vast amounts of data on a weekly basis. Initially, the project involved processing millions of rows of data, which are now seamlessly retrieved and processed from various external providers. This solution has completely eliminated the need for manual intervention, such as using Excel files or email communications, to manage and distribute the data. The project resulted in the development of thirty distinct databases, each one aligned with the unique requirements of different business units across the organization.
One of the most transformative aspects of this system is the data harmonization process, which ensures that all incoming data, regardless of its original source, speaks the same language. This harmonization process is critical in ensuring that data from different providers is comparable and accurate, allowing for consistent and reliable reporting across all business units.
Approval Workflow and Data Validation
The system also introduced a robust data approval workflow, which enables country-specific users to approve or reject the data they receive. When the data arrives, the users are able to validate it through a dedicated application, which is integrated into the solution. If discrepancies are identified—such as missing or incorrect data—the users can reject the data with a single click. This action automatically triggers an email notification to the provider, requesting the correct data. Once the updated data is received, the system automatically processes it, and users are notified when the data is ready for approval.
In cases where the product descriptions from different providers differ, the system leverages machine learning algorithms developed in collaboration with the data science team to automatically match similar products.
Unified Reporting and Master Data Management
The system also introduced a unified reporting structure that allows all global sales directors to view data consistently, regardless of their region. This harmonized approach to reporting ensures that all users see the same metrics and can analyze performance based on consistent Key Performance Indicators (KPIs). The reports generated by the system offer actionable insights into market trends, product performance, and competitor positioning, which empower decision-makers to make informed strategic choices.
A significant part of this process involved mapping over a thousand brands and identifying two hundred competitors from the different markets. This mapping process is conducted monthly and is essential for ensuring that the data is comparable across regions. The dashboards populated with these data sets help track performance metrics and provide a clear overview of the company’s position relative to its competitors.
Impact and Value Realization
The immediate impact of this transformation was substantial. Prior to implementing the automated system, the company relied heavily on Excel-based processes that were time-consuming, error-prone, and inefficient. The shift to a fully automated solution allowed for quicker access to accurate data, providing immediate value to the organization. Although it is challenging to quantify the exact time and cost savings—given the scale of the transformation—the improvement in operational efficiency and accuracy is undeniable. The introduction of an automated, scalable solution has saved countless hours of manual labor and has freed up resources for more strategic activities.
The project’s success was recognized by key stakeholders, including the product owner, who directly praised the solution. This positive feedback has fostered a stronger working relationship with the customer, particularly with the product owners who trusted the team to deliver innovative technological solutions.
This relationship was pivotal in the development of more advanced features within the system, such as the ability to track mission-critical data and analyze customer behavior, which is essential for driving future product innovations, such as new flavors. By gaining deeper insights into customer preferences and market trends, the company has been able to guide the future development of their product line more effectively. This project has significantly boosted the company’s knowledge base, enabling more informed decision-making at all levels of the business.