Introduction to Advanced Data Analysis
Definition
Advanced data analytics represents a broad set of data analysis techniques used within the context of business decision-making.
In real-world scenarios, business professionals do not typically approach data analysts with highly technical requests such as, “I need a SQL query to join multiple tables and extract a KPI.” Instead, they present real-life business problems that require data-driven solutions. The role of an analyst is to interpret these challenges, identify the relevant data, and apply appropriate analytical techniques to generate actionable insights.
Analysis Spectrum
Advanced data analytics encompasses a wide spectrum of analytical methods, ranging from descriptive and diagnostic analytics to predictive and prescriptive approaches. The primary objective of advanced data analytics is to enable businesses to make informed decisions based on data-driven insights. As a well-known figure in the data industry once stated, “An opinion without data is just an opinion.” This statement underscores the fundamental role of analytics in transforming raw data into meaningful and actionable information.
The analytical process follows a structured progression, beginning with descriptive analytics and advancing toward more complex predictive and prescriptive techniques.
Descriptive Analytics
Descriptive analytics is the foundation of data analysis and is often the first step in deriving insights from data. The primary goal is to provide a clear picture of what has happened in the past, typically using historical datasets. This form of analysis involves identifying patterns, trends, and key performance indicators (KPIs) to summarize business performance.
In practical applications, most data processing pipelines operate on a daily cycle. Data from various sources is collected and processed overnight, meaning that the reports generated each morning reflect information up to the previous day. As a result, descriptive analytics is inherently retrospective, focusing on past performance rather than real-time or future events.
Diagnostic Analytics
Once descriptive analytics provides an overview of past events, the next step is diagnostic analytics, which seeks to answer why certain events occurred. This stage involves exploring relationships, correlations, and potential causative factors behind observed data patterns.
For example, if a company notices a decline in sales, diagnostic analytics can help determine whether external factors such as seasonality, marketing effectiveness, or economic conditions played a role. By analyzing historical data in greater depth, businesses can identify root causes and make more informed decisions about future strategies.
Predictive Analytics
After understanding what happened and why, the next logical step is to predict what is likely to happen in the future. Predictive analytics involves using statistical models, machine learning algorithms, and historical trends to forecast future events.
For instance, a retailer might use predictive analytics to anticipate whether a spike in sales during the holiday season will occur again next year. Similarly, financial institutions use predictive models to assess the likelihood of loan defaults based on past customer behavior. The strength of predictive analytics lies in its ability to provide probabilistic insights, helping businesses prepare for upcoming trends and mitigate potential risks.
Prescriptive Analytics
The final stage in the analytics spectrum is prescriptive analytics, which goes beyond forecasting to provide actionable recommendations. The objective is not only to predict future outcomes but also to determine the best course of action to achieve desired results.
For example, an e-commerce company might use prescriptive analytics to recommend personalized promotions for customers, increasing the likelihood of a purchase. Similarly, a supply chain manager might optimize inventory levels based on predictive demand forecasts to reduce costs and avoid stock shortages.
Data, Information, Insights and Knowledge
In the field of advanced data analytics, it is essential to differentiate between data and information. While both concepts are interconnected, they are not the same.
Definition
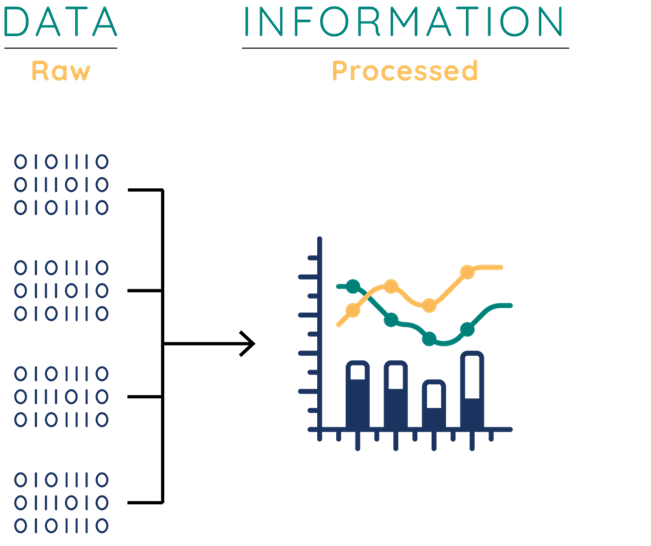
Data, in its raw form, consists of unprocessed facts—objective occurrences that take place in the world. These facts can exist in various formats, such as numerical values, text, images, audio recordings, and even signals from devices like home thermostats.
The defining characteristic of data is its measurability. It can be recorded, stored in databases or cloud systems, and transmitted across networks. However, in its raw state, data lacks immediate usefulness.
Businesses generate massive amounts of data continuously, and individuals also contribute to data generation in their daily lives. For instance, when someone purchases a croissant at a café, a transaction record is created. When they validate their ticket on public transportation, another data point is logged. While these pieces of data exist, they are not yet meaningful or actionable. To extract value, data must be processed and structured, transforming it into information.
Definition
Information is data that has been processed, structured, and contextualized to serve a specific purpose. It becomes the foundation for decision-making in businesses.
In data analytics, analysis is not performed for its own sake—it is always conducted within a specific context, such as business decision-making. Without context, raw data remains meaningless.
Consider the process of acquiring new customers in a company. A salesperson attends an industry event, interacts with potential clients, and collects business cards containing names, phone numbers, and email addresses. When they return to the office, they enter this data into the company’s Customer Relationship Management (CRM) system, generating a list of leads—potential business opportunities.
However, merely knowing that the company received 2,000 new leads last month is insufficient. The real value emerges when this data is placed in context. If, for instance, the number of leads has increased by 20% compared to the past six months, this contextualization provides insight. The sales team can now recognize their success and attribute it to specific efforts.
Yet, even at this stage, the information alone is not enough to drive strategic action. To truly leverage data, businesses must go a step further—to insights and knowledge.
Definition
Insights represent a deeper level of understanding derived from data analysis.
Continuing with the lead generation example, an initial assumption might be that the recent event contributed to the increase in leads. However, upon closer examination, the data might reveal that the primary driver of new leads was actually a recently introduced live chat feature on the company’s website.
Definition
Knowledge is what remains in human memory even after specific data points fade.
While the exact figures—such as the 20% increase in leads—may not be remembered long-term, the core lesson will persist: digital engagement, such as live chat, is more effective than traditional event-based marketing. With this knowledge, businesses can refine their long-term strategies and continuously improve their processes.
The Hierarchy of Data Analytics
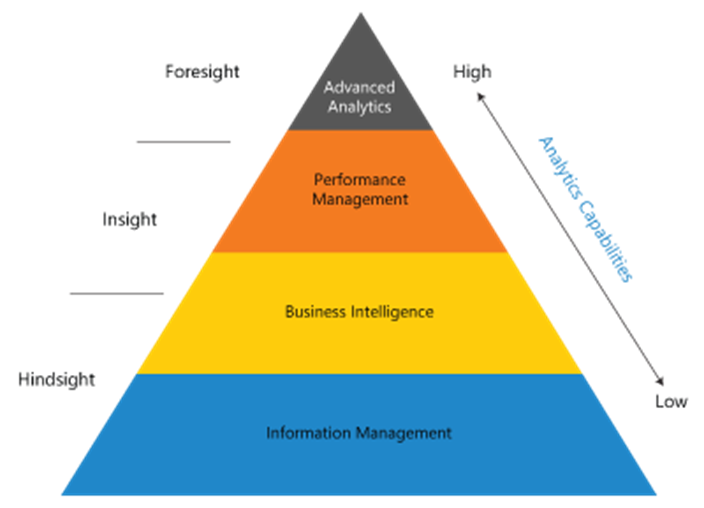
The process of transforming data into actionable knowledge follows a structured hierarchy, often depicted as a data analytics pyramid with several layers:
- Information Management: This foundational layer includes business tools such as CRM systems, Enterprise Resource Planning (ERP) software, and order management systems. These platforms collect and store data, providing a digital infrastructure for business operations.
- Business Intelligence (BI): At this level, structured data is analyzed to generate insights. BI focuses on reporting, dashboards, and performance tracking, allowing organizations to understand historical trends and current business performance.
- Performance Management: Building on BI, this layer shifts the focus to business strategy. It involves measuring performance, setting targets, and making data-driven adjustments to optimize operations.
- Advanced Analytics: The top layer of the pyramid encompasses sophisticated techniques such as machine learning, predictive modeling, and optimization algorithms. This level supports and enhances all the layers below it, enabling businesses to forecast trends and prescribe actions.
The Three Types of Insights in Data Analytics
Throughout the analytics process, different types of insights are generated:
- Insights (between information management and business intelligence): These help in understanding the present by explaining why specific events occurred. For example, discovering that an increase in leads was due to a live chat feature rather than an industry event.
- Foresights (between business intelligence and advanced analytics): These involve predicting future trends based on past and present data. This includes predictive analytics, where businesses anticipate market demand or customer behavior.
- Knowledge (the final outcome): This represents the deep understanding that remains after insights have been processed. It allows decision-makers to take strategic action based on past learnings.
The Iterative Nature of Data Analytics
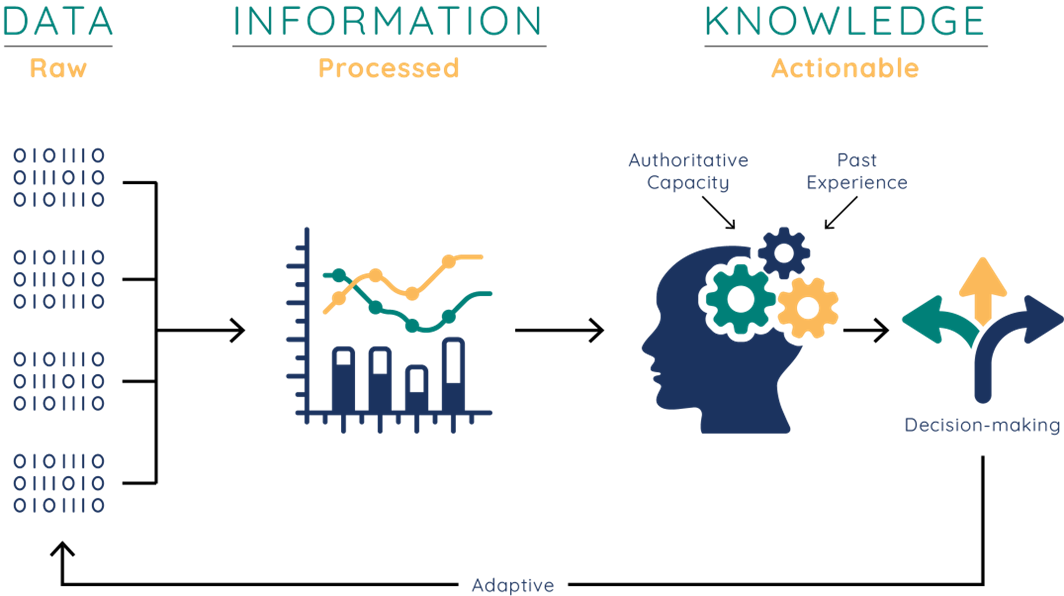
One of the most critical aspects of the data analytics process is that it is not linear—it does not simply move from point
This cyclical nature is crucial because businesses operate in dynamic environments, where data evolves, trends shift, and new challenges emerge. As a result, data-driven strategies must also evolve. Organizations must not only analyze historical patterns but also adjust and optimize their approach as new data becomes available.
At the core of this process is knowledge—the ability to integrate past experiences and analytical insights to inform and improve future decisions. By leveraging knowledge, companies enhance their capacity to anticipate challenges, seize opportunities, and sustain competitive advantages.
Organizations often rely on specialized consulting firms to help them unlock the full potential of their data. SDG, a consulting company specializing in data, AI, and analytics, exemplifies this role by assisting businesses in:
- Harnessing the power of data to drive innovation and efficiency
- Building data-driven strategies to enhance decision-making
- Creating value through advanced analytics and AI applications
Business Intelligence
Business Intelligence (BI) is a crucial layer within the broader spectrum of data analysis. It serves as the foundation for extracting valuable insights from raw data, primarily focusing on descriptive and diagnostic analytics. While BI is not inherently predictive or prescriptive, it can incorporate these advanced analytics techniques to enhance its capabilities. Essentially, BI transforms unstructured data into meaningful insights that drive decision-making.
Companies invest in Business Intelligence because it provides them with a competitive advantage. By systematically analyzing their own performance as well as that of their competitors, businesses can identify patterns, trends, and opportunities. This data-driven approach enables organizations to make informed strategic decisions, optimize operations, and enhance market positioning.
”Insight Factory”
In modern enterprises, Business Intelligence is often seen as a structured process involving methodologies, architectures, and technologies that work together to convert raw data into actionable insights. The process begins with the identification and structuring of data, which is necessary to create a reliable foundation for analysis.
Once the data is structured, the next step involves defining the output—determining what kind of analysis is required and how the data should be interpreted. This phase includes designing analytical models, building databases, and, in recent years, utilizing data lakes to store and manage large volumes of information efficiently.
After structuring and organizing the data, it must be processed and analyzed. However, raw data in itself does not provide immediate insights. This is where data visualization techniques come into play. Dashboards, reports, and interactive tools are developed to present complex data in a clear and understandable manner, enabling decision-makers to extract meaningful conclusions and take necessary actions.
Technical Scope
From a technical perspective, Business Intelligence leverages various data processing and visualization tools to extract, transform, and present information in a meaningful way. The process typically involves:
Steps
- Data Collection and Integration: Gathering data from multiple sources, such as transactional databases, APIs, cloud storage, and external data providers.
- Data Warehousing and Management: Storing structured and unstructured data in organized formats, such as data warehouses and data lakes.
- Data Transformation and Modeling: Cleaning, normalizing, and structuring the data using ETL (Extract, Transform, Load) processes to ensure consistency and accuracy.
- Analysis and Reporting: Utilizing descriptive and diagnostic analytics to identify trends and correlations within historical data.
- Data Visualization: Implementing dashboards, reports, and interactive charts to make data insights accessible and comprehensible to decision-makers.
Although Business Intelligence mainly focuses on historical data and performance reporting, it can be enhanced by incorporating advanced analytics techniques. By integrating predictive analytics, businesses can forecast future trends based on historical patterns. Furthermore, prescriptive analytics can suggest strategic actions to optimize business outcomes.
The History of Business Intelligence
The concept of Business Intelligence (BI) has evolved over centuries, with its origins dating back to the 19th century. At its core, BI is the ability to collect, interpret, and act upon data to make informed business decisions. The earliest documented use of the term can be found in Richard Millar Devens’ Cyclopædia of Commercial and Business Anecdotes (1865). Devens described how Sir Henry Furnese, a banker, leveraged information about his environment before his competitors, allowing him to gain a strategic advantage. This example illustrates one of the fundamental principles of Business Intelligence—using data to drive competitive advantage.
Over a century later, in 1958, Hans Peter Luhn, a researcher at IBM, used the term “business intelligence” in a more structured manner. Luhn, drawing from Webster’s Dictionary, defined intelligence as the ability to recognize interrelationships among facts to guide actions toward a desired goal. His perspective laid the foundation for BI as a field focused on fact-based decision-making.
By the late 20th century, Business Intelligence had begun to take shape as a formal discipline. In 1989, Howard Dresner, later a Gartner analyst, introduced the term as an umbrella concept encompassing methodologies, processes, architectures, and technologies that transform raw data into meaningful insights. This definition recognized BI as a structured approach to supporting strategic, tactical, and operational decision-making.
The definition of Business Intelligence continued to evolve into the 21st century.
Quote
“Business intelligence is a set of methodologies, processes, architectures, and technologies that transform raw data into meaningful and useful information used to enable more effective strategic, tactical, and operational insights and decision-making”
Forrester Research
The Foundations of Business Intelligence
Business Intelligence operates as a structured process that involves several key phases:
- Data Identification and Structuring: The first step in BI is gathering raw data from various sources, including internal databases, cloud platforms, and external market data. This data must be cleaned, standardized, and structured to ensure accuracy and usability.
- Expected Output Definition: Before conducting any analysis, it is crucial to define the objectives of the BI process. This includes determining the key performance indicators (KPIs) and the specific insights that decision-makers need.
- Database Model and Design: Once data is structured, it is stored in databases, data warehouses, or data lakes. These systems organize the data in a way that enables efficient retrieval and analysis. The choice of database architecture significantly impacts the effectiveness of BI applications.
- Dashboard and Visualization Design: The final step in the BI process is data presentation. Raw data alone does not provide immediate value; it must be visualized through dashboards, reports, and interactive tools. Data visualization techniques help businesses interpret trends, patterns, and correlations, enabling faster and more informed decision-making.
Standard Architecture of Business Intelligence
A standard business intelligence (BI) architecture serves as the framework for transforming raw data into valuable insights. This architecture is designed to be technology-agnostic, meaning that while specific tools and platforms may vary, the underlying structure remains largely the same across different implementations.
The process begins with an information management system, which is responsible for generating data. When engaging with a client on technical aspects, the first key question is: What are the source systems? Understanding where data originates is essential for extracting and processing it effectively.
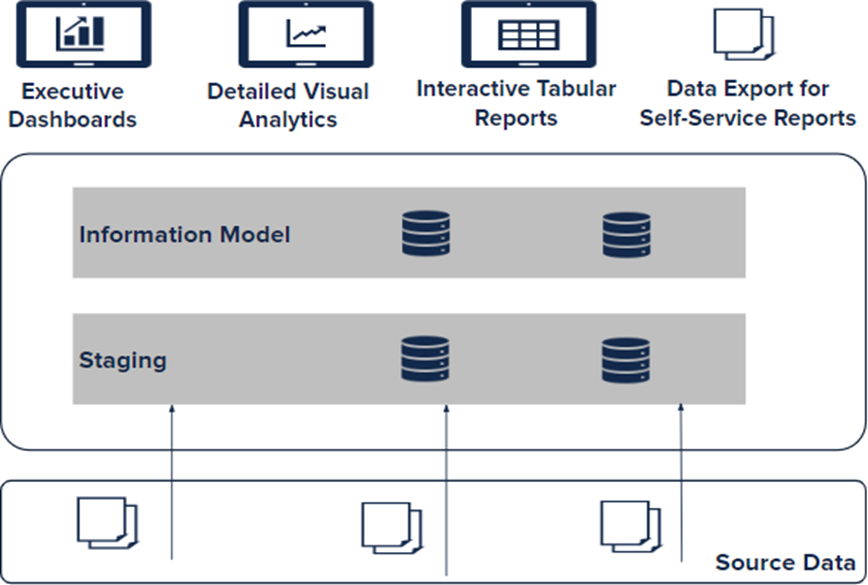
Once collected, the data is transferred to an enterprise data platform, which consists of multiple layers depending on the architecture type. A typical implementation includes:
- Staging Area: This is where raw data is temporarily stored after being extracted from source systems. At this stage, the data remains unaltered but is duplicated to ensure that the original records are preserved.
- Data Cleaning and Transformation: Here, various data quality measures are applied to standardize, cleanse, and validate the data. This ensures that the information is consistent and ready for analytical processing.
- Reporting Layer: This final stage comprises different forms of data visualization and analysis. It may include:
- Executive dashboards for high-level decision-makers.
- Operational dashboards for detailed insights into business processes.
- Tabular reports, allowing structured data analysis.
- Self-service BI, enabling business users to perform their own data explorations.
Example
For instance, a recent real-world case involved an executive team struggling to keep up with traditional BI reports. Even when presented with a dashboard summarizing key performance indicators (KPIs), executives often lacked the time to analyze them in-depth. To solve this problem, an AI-driven reporting assistant was introduced.
Every Monday morning, an AI system automatically extracts key insights from reports and sends an audio message via WhatsApp to executives. This allows them to listen to critical updates while commuting to work. If further analysis is needed, they can then access the full report from their mobile device or computer.
Business Intelligence Across Industries and Processes
Business Intelligence (BI) plays a crucial role in solving real-world business problems across various industries. Organizations rely on BI to answer complex questions, optimize processes, and enhance decision-making. The application of BI varies by industry, but the fundamental goal remains the same: to extract value from data and turn it into actionable insights.
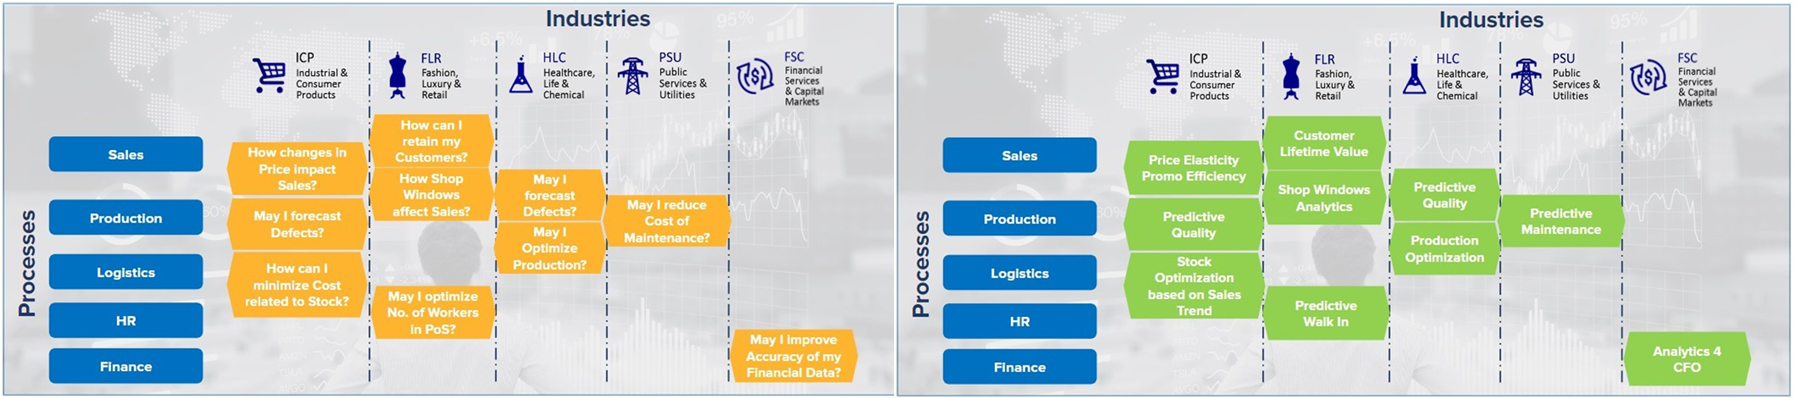
- Sales and Pricing Optimization: In the industrial and consumer products sector, companies use BI to understand how pricing strategies impact sales performance. By conducting pricing elasticity and promotion efficiency analyses, businesses can optimize pricing strategies to maximize revenue and profitability.
- Workforce Optimization: In luxury, fashion, and retail HR, companies leverage BI to balance cost efficiency and customer service. By analyzing foot traffic patterns and staffing schedules, businesses can optimize workforce allocation to enhance customer experiences.
- Defect Reduction and Waste Minimization: In healthcare, life sciences, and chemicals, BI helps companies improve production processes by forecasting potential defects. By analyzing operational data, businesses can identify patterns that lead to quality issues and take proactive measures to reduce waste and save costs.
While some business challenges are common across industries (e.g., HR optimization), others vary significantly depending on the nature of the business. For example:
Example
- Supermarkets and retail chains deal with massive datasets since every transaction involves multiple items. Their primary focus is volume-based sales and optimizing profit margins on high-turnover products.
- Luxury brands, on the other hand, have significantly fewer sales transactions. A boutique may sell only a few handbags per day, but each transaction has a high-profit margin. Instead of volume, they prioritize exclusive customer experiences and brand positioning.
This variation highlights how BI solutions must be tailored to each industry’s unique business model. Whether it’s analyzing millions of supermarket transactions or assessing luxury brand sales trends, BI provides data-driven strategies to enhance performance.
Business intelligence adoption typically progresses from IT-driven reporting to full self-service capabilities for business users.
- IT-Driven Reporting: Initially, the IT department manages BI, creating and distributing reports to business users.
- Business User Involvement: As data literacy grows, business users start building their own dashboards, while IT maintains the data infrastructure.
- Self-Service Analytics: In mature BI stages, employees across departments perform data analysis independently, using tools like Power BI for desktop and mobile access.
Business Intelligence (BI) Analysis
A Business Intelligence (BI) analyst operates at the intersection of technical expertise and business understanding. This role requires a diverse set of skills that span across data engineering, statistical analysis, data visualization, and problem-solving. A BI analyst’s toolset includes programming languages, data processing frameworks, and visualization platforms, but just as important are the soft skills needed to interpret and communicate insights effectively.
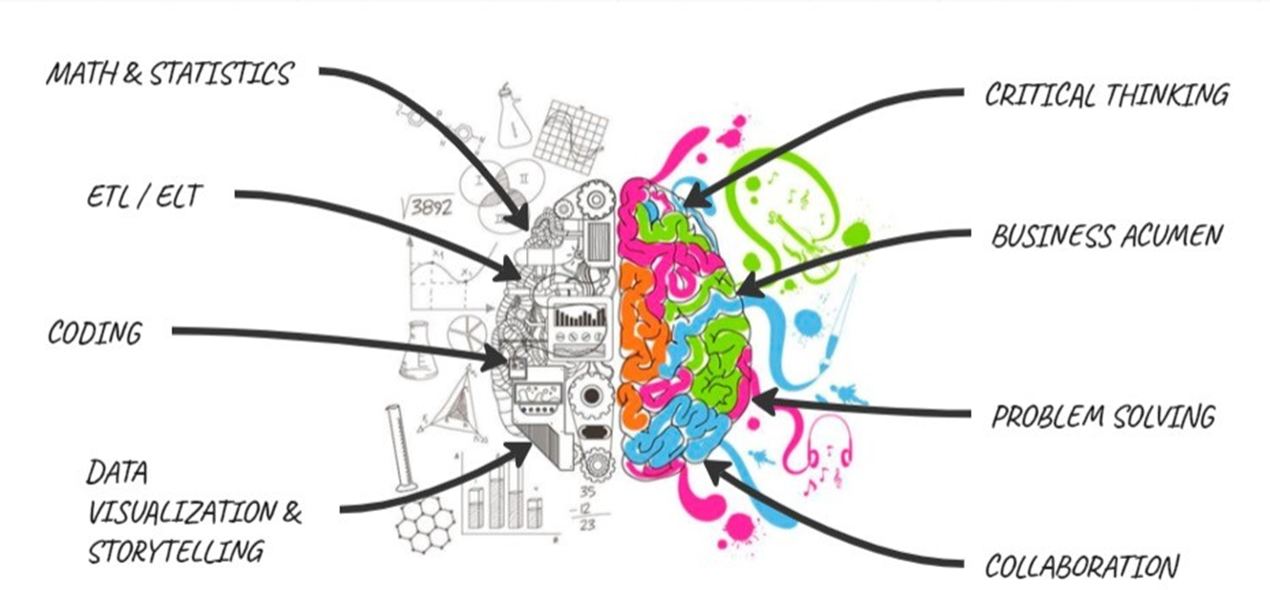
The fundamental technical and soft skills required in BI analysis are:
| Skills | Description | |
|---|---|---|
| Technical Skills | Mathematics and Statistics | Business-oriented analytics primarily involves descriptive statistics, such as percentage variations, trend analysis, and error margins between variables. The focus is on extracting meaningful insights from data rather than performing complex mathematical derivations. |
| ETL/ELT Processes | This involves sourcing data from various systems, transforming it into a usable format, and loading it into a data warehouse or database for analysis. A solid grasp of SQL is crucial for querying databases and extracting relevant information. | |
| Programming Languages | Proficiency in Python, R, or other statistical programming languages is essential for data manipulation and analysis, used to perform advanced statistical modeling, machine learning, and data visualization tasks. | |
| Data Visualization Tools | BI analysts work with data visualization tools such as Power BI or Tableau to create interactive dashboards and reports, explore data visually, identify trends, and communicate insights effectively. | |
| Soft Skills | Critical Thinking | BI analysts must be able to interpret data and identify patterns that drive business decisions. This requires a logical mindset and the ability to think critically about data sources, analysis methods, and results. |
| Business Acumen | Understanding industry-specific metrics, key performance indicators (KPIs), and operational constraints is crucial for translating data into actionable insights. | |
| Problem-Solving | BI analysts often encounter complex data challenges that require creative solutions. The ability to troubleshoot data discrepancies, optimize reporting mechanisms, and improve data visualization is essential. | |
| Collaboration | BI analysts work closely with data engineers, data scientists, project managers, and business users to deliver insights. The ability to collaborate effectively with cross-functional teams is crucial for successful BI implementations. |
Data and Value in Business Intelligence
In the current data-centric world, the transformation of raw data into actionable knowledge and tangible value has become a crucial process for businesses seeking to stay competitive. This transition involves several important considerations that shape the effectiveness of data-driven projects, ensuring they meet business goals and deliver real benefits.
- Data Quality: A fundamental aspect of deriving value from data is ensuring its quality. High-quality data is the foundation of any effective business intelligence project. If the data you are working with is unreliable or inaccurate, even the most sophisticated dashboards or analytical tools will yield little to no value. The importance of data accuracy, consistency, and completeness cannot be overstated, as poor-quality data will lead to misleading insights, potentially damaging business decision-making processes.
- Context: The context in which data is analyzed plays a critical role in the effectiveness of the insights derived from it. Data alone is often meaningless without understanding the business environment in which it exists. Before drawing conclusions or making recommendations based on data, it’s essential to understand the business objectives, operational environment, and the specific challenges being addressed.
- Business Relevance: In any data project, especially when building a Business Intelligence (BI) department, the focus should always be on data that directly impacts business goals. Business leaders typically prioritize metrics that relate to key business functions such as sales, operations, or customer satisfaction.
- Agility: In a rapidly evolving technological landscape, agility is essential for success in BI projects. The tools and technologies used in data analysis, such as Power BI, are constantly updated, with new features released regularly. Staying up to date with these developments is crucial, as they can significantly enhance analytical capabilities.
The BI Life Cycle
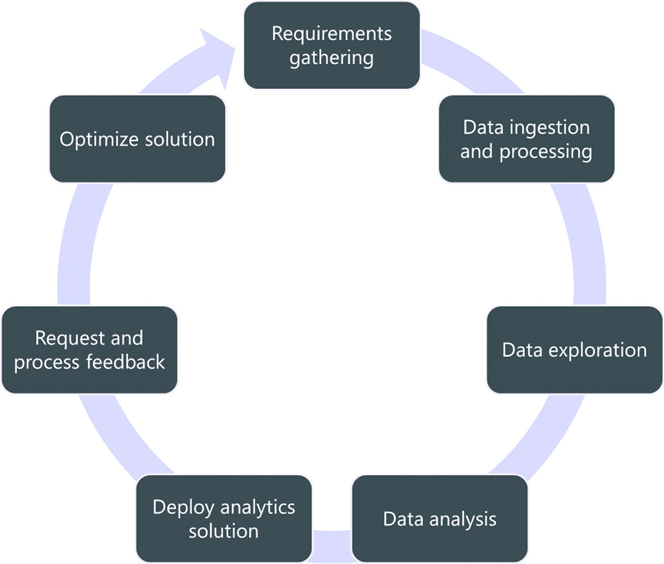
The process of converting data into value is iterative and adaptive, and this is especially true in the BI life cycle. The typical flow of a BI project involves several distinct phases, each of which requires careful planning, execution, and review.
- Requirement Gathering: Collaborate with stakeholders to define key business problems and prioritize valuable data points, ensuring alignment with business goals.
- Ingestion and Processing: Collect, clean, and prepare raw data from various sources for analysis.
- Data Exploration: Conduct initial analyses to understand the dataset, identify issues, and refine the project scope.
- Data Analysis: Apply advanced techniques and create visualizations to uncover insights and design final dashboards or reports.
- Deployment: Test, refine, and integrate the solution into the company’s tech stack, treating it as a continuous product.
- Feedback Loop: Gather user feedback to address issues and improve the solution’s performance and reliability.
- Optimization: Continuously refine the solution based on feedback to better meet business needs.
- Continuous Improvement: Evolve the project through ongoing updates and enhancements to ensure long-term value.