Microsoft Business Application Ecosystem
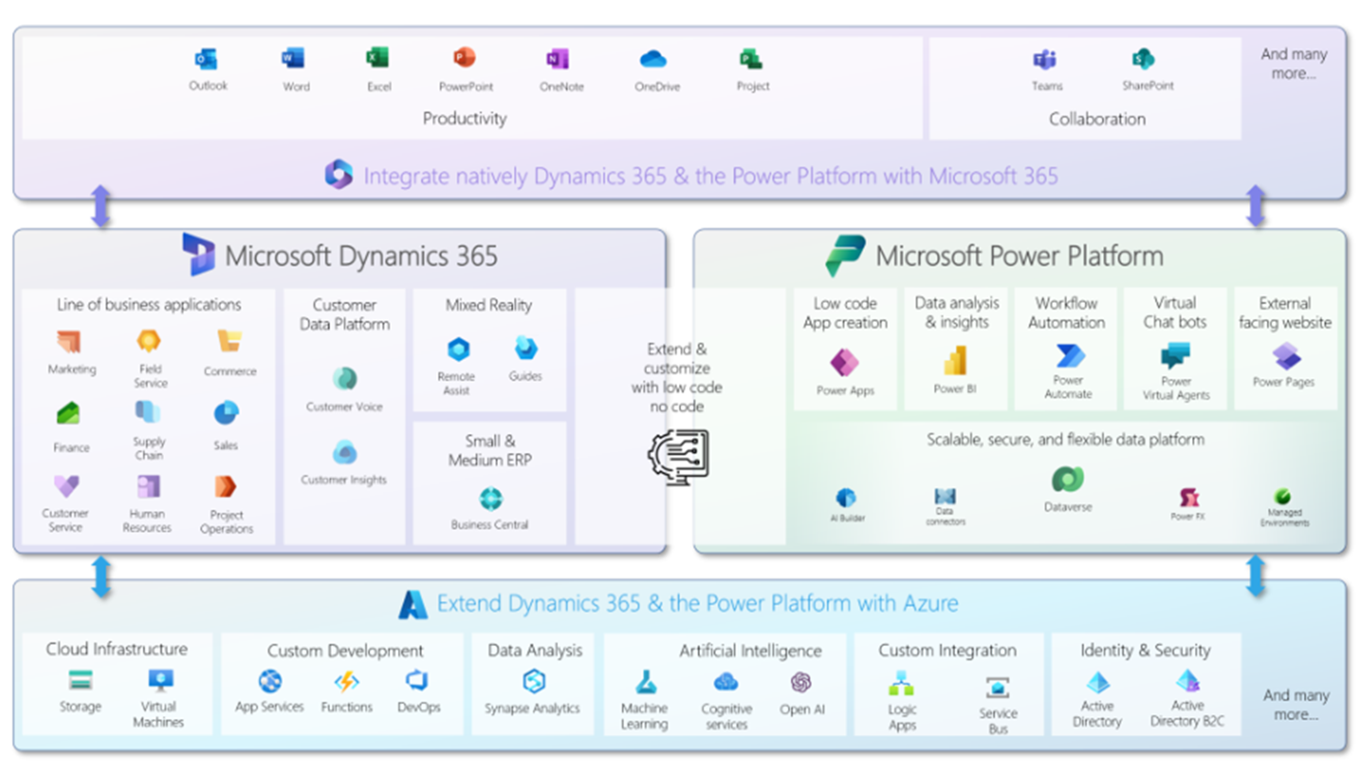
Microsoft has developed a comprehensive and interconnected ecosystem of applications that cover a variety of business needs. At the core of this ecosystem are three primary components: Microsoft 365, Dynamics 365, and Azure. These elements work together seamlessly to offer organizations solutions for productivity, collaboration, business management, and cloud computing.
-
Microsoft 365 Microsoft 365 includes the suite of productivity tools commonly used in workplaces, such as Word, Excel, PowerPoint, and Outlook. Additionally, it offers collaboration and communication tools like Microsoft Teams and SharePoint. These applications ensure that teams can efficiently collaborate, manage documents, and communicate in real time. Microsoft 365 is tightly integrated with other parts of the ecosystem, allowing data to flow easily across different platforms.
-
Dynamics 365 On the operational side, Dynamics 365 provides a suite of business applications specifically designed to support Enterprise Resource Planning (ERP) and customer relationship management (CRM). These applications are tailored to manage various business functions, including finance, sales, customer service, and supply chain operations. For instance:
- Business Central: A comprehensive ERP solution designed for small to medium-sized enterprises (SMEs). It helps companies manage their financials, operations, sales, and customer service within a unified system.
- Dynamics 365 CRM: This system focuses on managing customer relationships by providing tools for sales automation, customer service, marketing, and support.
-
Azure At the foundation of Microsoft’s ecosystem is Azure, the company’s cloud computing platform. Azure provides a wide array of services, ranging from AI and machine learning to storage, networking, and security. Businesses often use Azure for hosting applications, managing large datasets, and deploying scalable AI solutions.
Azure’s integration with Dynamics 365 and Microsoft 365 means that businesses can harness powerful analytics and computing capabilities directly within their operational and productivity tools.
Power BI plays a crucial role in this ecosystem by serving as the primary tool for data visualization and business intelligence. It allows organizations to aggregate data from various sources, including Dynamics 365, Microsoft 365 applications, and even external databases or third-party services. Users can then create interactive dashboards and reports, providing stakeholders with clear, data-driven insights.
With Power BI’s Power Query engine, users can connect to multiple data sources, transform and clean the data, and generate meaningful reports. It also supports advanced analytical functions, including AI-powered insights, predictive analytics, and customized visualizations.
Microsoft Power Platform
The Power Platform consists of a suite of tools designed for low-code and no-code application development. These tools enable users to build applications, automate workflows, create data visualizations, and develop web pages without needing extensive programming knowledge. While Power Platform applications are often drag-and-drop based, some level of coding can be applied for more advanced customization.
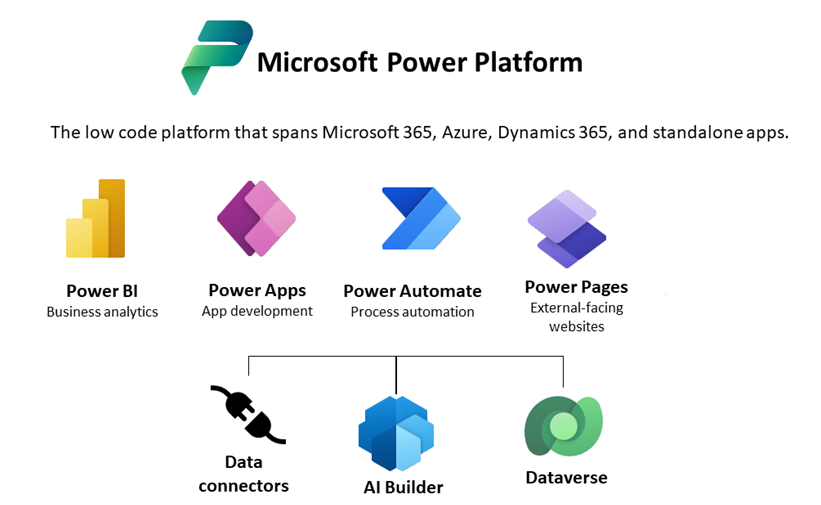
The Power Platform consists of four main products:
- Power BI: A business intelligence tool for creating data visualizations and reports.
- Power Apps: A low-code application development platform that allows users to build mobile or desktop applications for internal use.
- Power Automate: A workflow automation service that helps users automate repetitive tasks by creating triggers and automated actions.
- Power Pages: A no-code platform for creating responsive websites, often used for external-facing portals.
Example
For example, you can build a Power App to collect data, visualize the data using Power BI, and automate processes with Power Automate. Additionally, Power Pages can be used to display data on a public or internal website, making it accessible to a broader audience.
Power BI
Power BI is the platform’s primary tool for business intelligence (BI) and data visualization. It serves both self-service BI and enterprise BI use cases, meaning that it is suitable for both individual users looking to generate reports and large organizations seeking to analyze complex datasets.
With Power BI, you can connect to a wide range of data sources, including databases, cloud storage, Excel files, and APIs. The Power Query engine, which is built into Power BI, allows you to clean, transform, and combine data from multiple sources. This data is then visualized through interactive dashboards and reports, providing actionable insights for decision-makers.
One of Power BI’s strengths is its intuitive drag-and-drop interface, making it accessible to users without a technical background. While it supports coding with DAX (Data Analysis Expressions) for advanced calculations and M language for complex data transformations, most tasks can be performed without writing a single line of code.
Practical Applications and Integration
The real power of Power BI is evident when it is integrated with other components of the Power Platform. For example:
Power Apps Integration: You can embed a Power App directly within a Power BI report. This allows users to take actions like approving or rejecting data entries without leaving the report. For instance, a supply chain manager can view a dashboard displaying supplier performance metrics and approve a pending order using a Power App embedded within the report.
Power Automate Integration: Power Automate can be used to schedule and automate tasks such as refreshing data in Power BI reports. A workflow can be configured to trigger a report refresh at specific intervals, ensuring that decision-makers are always working with the latest data. Additionally, it can automate notifications, sending alerts to relevant stakeholders when certain thresholds or KPIs are met.
Power Pages Integration: For scenarios where external users need to interact with data, Power Pages provides a web-based solution. Reports and dashboards from Power BI can be embedded into a Power Pages site, giving users access to key insights without needing to log into Power BI directly.
Why Choose Power BI?
Power BI has established itself as a leading tool in the field of data visualization and business intelligence. Its dominance is evident from its continuous recognition by Gartner, a prominent research and advisory company that evaluates software vendors across various categories. For seventeen consecutive years, Power BI has maintained its position in Gartner’s Leader Quadrant in the Magic Quadrant for Analytics and Business Intelligence Platforms, demonstrating its consistent excellence and market leadership.
Flexibility and Licensing
One of the key advantages of Power BI is its flexible licensing model, which makes it accessible to individuals, small businesses, and large enterprises alike. Users can start using Power BI with no license by downloading Power BI Desktop, which offers extensive capabilities for data analysis and visualization. For more advanced features, such as collaboration and sharing, Microsoft offers tiered licensing:
- Free License: Provides basic access to Power BI Desktop for personal use, enabling users to create reports and visualizations without any cost.
- Pro License: Designed for professionals who need to publish, share, and collaborate on reports. It is commonly used within organizations for team-based analytics.
- Premium License: Suited for enterprises with large-scale data needs. It provides additional features such as AI capabilities, dataflows, and support for larger datasets.
This licensing flexibility makes Power BI a cost-effective choice for businesses.
Extensive AI Capabilities
Microsoft has integrated artificial intelligence (AI) features, allowing users to perform advanced data analysis with minimal effort. Additionally, they continues to enhance Power BI with new AI-driven capabilities. Features like Copilot AI provide automated insights, suggest relevant visuals, and assist with data analysis using natural language queries.
Integration and Connectivity
Another major strength of Power BI is its seamless integration with both Microsoft products and external platforms. Power BI offers more than 280 native connectors, allowing users to connect directly to various data sources such as:
- Microsoft Excel and SharePoint for internal data management.
- Salesforce, SAP, and other enterprise systems for customer and operational data.
- Web APIs and cloud databases for real-time data retrieval.
These connectors make it easy to integrate data from multiple sources into a unified dashboard. Additionally, Power BI supports the creation of custom connectors, allowing organizations to build specialized data integrations when a native connector is unavailable.
Common Development Methodology in Power BI
When working with Power BI, there is a structured process that developers typically follow to ensure the efficient creation of reports and dashboards. This methodology consists of several stages, each designed to refine the data, build meaningful visualizations, and share insights effectively.
1. Query Creation and Data Preparation
The first step in any Power BI project involves importing and transforming data using the Power Query Editor. Power Query is a powerful ETL (Extract, Transform, Load) tool that provides a user-friendly interface for data manipulation. It uses a functional language called M to perform various data operations.
In this stage, developers connect to data sources and apply a series of transformations, including:
- Filtering to remove unnecessary data.
- Formatting to ensure consistency in data types.
- Cleaning to handle missing or erroneous values.
- Combining data from multiple sources using merges and appends.
2. Data Modeling
Once the data is imported and cleaned, the next step is to build the data model. Power BI uses a star schema or snowflake schema for efficient data storage and querying. The model generally consists of:
- Fact Tables: Containing transactional or quantitative data.
- Dimension Tables: Providing contextual information, such as customer details, product categories, or time data.
In this phase, developers establish relationships between tables using primary and foreign keys. Additionally, during this step, they may optimize performance by:
- Removing unnecessary columns.
- Reducing dataset size.
- Applying appropriate data types.
3. Data Enrichment and Calculations
After setting up the data model, developers often add calculated fields and metrics using DAX (Data Analysis Expressions). DAX is a powerful formula language in Power BI that allows for the creation of:
- Calculated Columns: Derived columns based on existing data.
- Measures: Aggregated values for reporting, such as totals, averages, or percentages.
- KPIs (Key Performance Indicators): Metrics that track business objectives.
4. Data Exploration and Validation
Before designing visualizations, it is a good practice to perform exploratory data analysis (EDA) within Power BI. Developers can create temporary charts, tables, or matrices to:
- Identify anomalies or unexpected data patterns.
- Validate data accuracy by comparing it with source systems.
- Test the reliability of DAX calculations.
5. Report Design and Visualization
With a validated dataset, developers move on to designing the actual report. Power BI offers a wide variety of visualization options, including:
- Bar and Column Charts
- Line Charts
- Pie and Donut Charts
- Maps
- Tables and Matrices
- Gauge and KPI Cards
This is also the stage where developers implement specific business requirements, ensuring that the report serves its intended purpose.
6. Publishing and Sharing
Once the report is complete, the final step is to publish it to the Power BI Service. This cloud-based platform allows users to:
- Share reports and dashboards with other stakeholders.
- Set up data refresh schedules to ensure reports display up-to-date data.
- Implement security by applying row-level security (RLS) to restrict data access based on user roles.
Users can then access reports through their web browsers or mobile devices, gaining real-time insights from anywhere.
Components of Power BI
Power BI consists of three main components that serve different purposes across the reporting lifecycle: Power BI Desktop, Power BI Service, and Power BI Mobile.
-
Power BI Desktop is the primary application used for report creation and data modeling. It is installed locally on a user’s computer and provides a wide range of tools for building reports, performing data transformations, and designing dashboards.
-
Power BI Service is the cloud-based platform that allows users to publish, share, and manage reports online. It facilitates collaboration by enabling teams to access reports via a web browser. Additionally, the service supports scheduling data refreshes, implementing security using role-based access control, and setting up automated workflows for report distribution.
-
Power BI Mobile provides a responsive application designed for viewing reports and dashboards on smartphones and tablets. Users can download the Power BI mobile app from their respective app stores, offering a seamless experience for accessing and interacting with reports on the go. Even with a free license, you can explore the reports created in Power BI Desktop through the mobile app, gaining insights anytime and anywhere.
Power BI Desktop
When working in Power BI Desktop, the interface is divided into three primary views, each designed to assist with specific tasks:
-
Report View:
Marked by a bar chart icon in the top left corner, the Report View serves as the central space for report creation. It contains a blank white canvas where developers can drag and drop visualizations, apply filters, and customize report layouts. This view also includes:- Filter Pane: Used to apply and manage report-level, page-level, or visual-level filters.
- Visualization Pane: Provides a variety of charts, graphs, and other visual elements to represent data.
- Fields Pane: Displays all data fields from the loaded dataset, which can be used to build visualizations or create calculations using DAX.
-
Data View:
This view allows users to inspect the underlying data that has been imported into the data model. It provides a tabular representation of tables, making it easier to verify data quality and apply quick transformations. This is particularly useful when validating data after loading it from external sources. -
Model View:
In the Model View, users can visualize and manage the relationships between tables. Establishing relationships using primary and foreign keys enables the development of a robust data model, ensuring accurate cross-table analysis. Users can also create calculated tables and manage hierarchies in this view.
Data Source and Loading with Power Query
Power Query is an essential component of Power BI, serving as a powerful data transformation and preparation engine. It follows the ETL (Extract, Transform, Load) process, meaning it extracts data from various sources, applies transformations, and loads the refined data into the Power BI data model.
The Power Query Editor provides a graphical interface to perform data operations without the need for extensive coding. While transformations can be done using its point-and-click interface, Power Query also supports scripting using the M language for more complex operations.
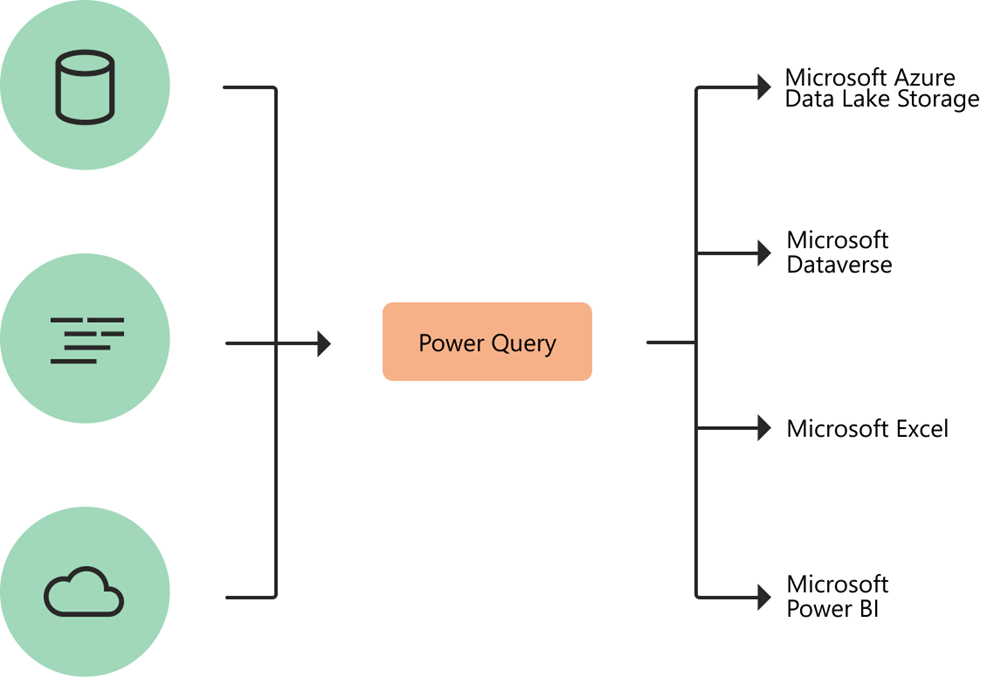
To connect to a data source in Power BI Desktop, follow these steps:
- Select Get Data from the Home tab in the ribbon.
- Choose the desired data source (e.g., Excel, SQL Database, REST API, or online service).
- Provide the necessary connection parameters, including credentials, server addresses, and database names.
- Upon successful connection, a Navigator window will display the available tables and views. Users can preview data to ensure accuracy before proceeding.
When importing data into Power BI, users have two primary options for data access: Import Mode and DirectQuery Mode.
-
Import Mode:
In Import Mode, Power BI takes a snapshot of the data and stores it locally in the.pbixfile. This mode is beneficial for scenarios where data does not require real-time updates. It offers better performance for complex calculations and interactive visualizations since data is held in memory. -
DirectQuery Mode:
DirectQuery Mode does not store data in Power BI; instead, it maintains a live connection to the source system. Queries are executed at the data source during runtime, ensuring users view real-time data. This mode is particularly useful for reports that require up-to-the-minute data, such as financial dashboards or operational monitoring.
Data Modeling in Power BI
Data modeling is a crucial aspect of working with Power BI, as it involves structuring data in a way that facilitates efficient analysis and insightful reporting. In Power Query, users can perform both simple and complex data transformation operations to prepare data for analysis. Transformations might include changing column data types, renaming fields, adding calculated columns, and applying various cleaning operations.
Beyond these transformations, Power Query also enables users to apply data shaping operations. Data shaping refers to the process of structuring and organizing data into a desired format before loading it into the data model. This may include operations like merging and appending datasets.
-
Merge: This operation combines data from two or more queries based on common columns, functioning similarly to a SQL join. It is typically used when there is a need to bring related data from different sources into a single table.
-
Append: In contrast, the append operation vertically stacks rows from multiple queries. It is useful when dealing with data from similar sources.
While the graphical interface in Power Query simplifies most transformations, users can also leverage the Advanced Editor to write custom transformations using the M language. This scripting approach provides greater flexibility, allowing for more complex manipulations beyond the standard tools available in the UI.
When building a data model in Power BI, it is common to work with multiple tables, typically consisting of fact tables and dimension tables.
-
Fact Tables: These tables contain quantitative data representing business events or transactions and often include numerical metrics that can be aggregated (e.g., revenue, quantity sold).
-
Dimension Tables: Dimension tables provide descriptive information about the data in the fact tables and help to add context to the numbers in fact tables, making analysis more meaningful.
Within Power BI Desktop, you can define a semantic model by establishing relationships between tables. Relationships are created using drag-and-drop functionality in the Model View. Power BI uses these relationships to connect tables logically, allowing users to analyze data from different sources in a unified manner.
Key Characteristics of Relationships
-
Cardinality:
Cardinality defines the nature of the relationship between two tables. The main types are:- One-to-One (1:1): Each record in Table
relates to one record in Table . - One-to-Many (1:N): A record in Table
can relate to multiple records in Table , while each record in Table relates to only one record in Table . This is the most common type of relationship. - Many-to-Many (N:N): Multiple records in Table
can relate to multiple records in Table . In such cases, an intermediary table (bridge table) is often used to manage the relationship.
- One-to-One (1:1): Each record in Table
-
Filter Direction:
Relationships in Power BI can have a single or both filter direction:- Single Direction: Filters applied to a dimension table will propagate to the fact table. This is typically used in one-to-many relationships.
- Both Directions: Filters can flow in both directions, which is useful in scenarios with many-to-many relationships or complex models where bidirectional filtering is necessary.
-
Active and Inactive Relationships:
Power BI allows only one active relationship between two tables at a time. Active relationships are used by default in visualizations and calculations. However, users can create multiple inactive relationships for alternative analysis purposes. Inactive relationships can be used selectively within DAX formulas using theUSERELATIONSHIPfunction.
Best Practices for Data Modeling
To build efficient and maintainable data models, consider the following best practices:
- Star Schema: Organize tables using a star schema with a central fact table surrounded by dimension tables. This design simplifies queries and improves performance.
- Avoid Data Duplication: Minimize data redundancy by storing descriptive data in dimension tables instead of repeating information within fact tables.
- Optimize Relationships: Ensure relationships are correctly established using appropriate cardinality and filter direction.
- Use Data Types Efficiently: Convert columns to suitable data types (e.g., integers for keys) to optimize storage and query performance.
- Create Calculated Columns Wisely: While calculated columns are useful for adding new fields, consider using DAX measures instead for better performance and flexibility.
DAX in Power BI
Data Analysis Expressions (DAX) is the formula language used in Power BI to create custom calculations and manipulate data within reports. It is a functional language, meaning instructions are executed using functions that can be nested for complex operations. DAX is particularly useful when working with large datasets that require aggregation, filtering, or custom calculations for analysis.
Definition
A basic DAX formula typically includes the following components:
- Measure Name: Every DAX formula starts with a measure name, which serves as a label for the result.
- Equal Sign (
=): The equal sign indicates the start of the formula, where the expression to be calculated is written.- Function: Functions like
SUM,AVERAGE, orCOUNTare commonly used in DAX to aggregate or calculate data. In the example above, theSUMfunction adds all values in theSalesAmountcolumn.- Parentheses
(): Functions require arguments enclosed in parentheses. Some functions may accept multiple arguments, separated by commas.- Arguments: Arguments provide data to functions, often in the form of table or column references like
Sales[SalesAmount].
DAX supports various types of calculations, each serving a distinct purpose in data modeling and visualization:
-
Measures Measures are dynamic calculations that adapt based on the context of filters and slicers in reports. They are not stored in tables but are calculated during query execution. Measures are often used to calculate totals, averages, or percentages.
Total Sales = SUM(Sales[SalesAmount]) -
Calculated Columns Calculated columns add new data directly to tables using DAX formulas. Unlike measures, these columns store results within the data model and are calculated during data refresh. They are useful for creating derived fields that are not present in the original dataset.
Profit Margin = Sales[SalesAmount] - Sales[CostAmount] -
Calculated Tables Calculated tables are generated using DAX expressions and are derived from existing tables. They are useful for creating summary tables, aggregations, or filtered subsets of data.
Top Sales = FILTER(Sales, Sales[SalesAmount] > 1000) -
Row-Level Security (RLS) DAX also supports Row-Level Security (RLS), which restricts data visibility based on user roles. By applying Boolean expressions (returning
TRUEorFALSE), you can limit the rows a user can access within a report. This is useful for ensuring sensitive information remains protected.[Region] = "West"
Data Visualization in Power BI
Creating effective visualizations is one of Power BI’s strengths. You can visualize data using a wide variety of charts, graphs, and tables. There are two primary ways to create visualizations:
- Drag and Drop You can drag fields from the Fields pane and drop them onto the report canvas. Power BI will automatically select a default chart type based on the data’s structure and type.
- Visualizations Pane The Visualizations pane provides a variety of visualization types, including bar charts, line graphs, pie charts, maps, and matrices. Selecting a visualization type will create a blank chart, which you can populate with data by assigning fields to appropriate sections like Values, Axis, or Legend.
After creating a visual, you can customize it using the three tabs available in the lower section of the Visualizations pane:
- Fields Pane: This pane is used to manage which fields are applied to the visualization. Different types of visuals will present different field options.
- Format Pane: The format pane allows detailed customization of the visual’s appearance. You can modify aspects like color, font size, axis labels, and gridlines to make your visualization more readable and visually appealing.
- Analytics Pane: The analytics pane provides options to add reference lines, trendlines, or other analytical elements to highlight patterns or anomalies within your data.
Power BI Service
Power BI Service is a cloud-based platform that provides a collaborative environment for sharing, managing, and interacting with reports and dashboards. It complements Power BI Desktop, where most of the report-building process occurs, and allows users to publish and share their insights with others in the organization. With its web-based interface, Power BI Service is particularly useful for business users, analysts, and decision-makers who need access to up-to-date data without requiring local software installation.
Power BI Service offers several essential features that enhance data-driven decision-making:
- Dashboards: Users can create dynamic dashboards by pinning visualizations from different reports. Dashboards provide a consolidated view of multiple datasets, offering quick insights into key metrics.
- Data Exploration: With interactive filters, slicers, and drill-through options, users can explore data to identify patterns, trends, and anomalies.
- Collaboration: Teams can collaborate efficiently by sharing reports, annotating insights, and providing comments directly within the reports.
- Scheduled Data Refresh: Users can schedule automatic data refreshes to ensure reports and dashboards are updated with the latest data, reducing manual intervention.
- Report Creation: While Power BI Desktop is more powerful for report building, Power BI Service allows users to create and modify simple reports using the web interface.
Publishing Reports to Power BI Service
After building a report in Power BI Desktop, you can publish it to Power BI Service to share it with others. Publishing ensures reports are accessible via a web browser, making it easier for stakeholders to view and analyze data.
Important Considerations:
- Unique Dataset Names: Power BI does not allow multiple datasets with the same name in a workspace. Publishing a report with the same dataset name will overwrite the existing one.
- Field and Measure Renaming: Changing field names, column names, or measures in a published dataset can lead to report errors.
Power BI Mobile
Power BI Mobile is a mobile application available for iOS, Android, and Windows devices. It allows users to access reports and dashboards from anywhere, ensuring decision-makers stay informed even when they are not at their desks.
- Anywhere Access: View live dashboards and reports securely from your phone or tablet, with data automatically updated based on scheduled refreshes.
- Interactive Exploration: Use touch gestures to interact with reports, apply filters, and explore data in a user-friendly format.
- Collaboration: Add comments, share insights with colleagues, and annotate visuals directly from the app.
- Real-Time Notifications: Receive alerts and notifications for data updates and anomalies. This feature is particularly useful for monitoring critical metrics.
- Device Adaptability: Power BI Mobile provides a responsive interface, optimizing the report viewing experience for smartphones, tablets, and other mobile devices.