Data Architecture
Data architecture is a foundational concept in the field of data management, serving as the blueprint for how data is collected, transformed, stored, and utilized within an organization. Just as architects design buildings to meet specific functional and aesthetic requirements, data architects design systems to ensure that data flows efficiently and effectively from its source to its end users.
The goal of data architecture is to enable organizations to extract maximum value from their data, transforming raw bytes into actionable insights.
This process involves a combination of technologies, methodologies, and best practices that have evolved significantly over time, particularly with the advent of big data and artificial intelligence.
Challenges and Best Practices in Data Architecture
While modern data architectures offer significant advantages, they also present new challenges. One of the primary concerns is data governance, particularly in environments where data is stored in its raw form. Without proper governance, data lakes can quickly become “data swamps,” where data is disorganized, inconsistent, and difficult to use. To mitigate this risk, organizations must implement robust data governance frameworks, including metadata management, data quality controls, and access controls.
Another challenge is ensuring that data architectures are scalable and cost-effective. As data volumes continue to grow, organizations must carefully balance the need for storage and processing power with the associated costs. Cloud-based solutions, such as Azure and AWS, offer a flexible and scalable alternative to on-premises infrastructure, enabling organizations to scale their data architectures in line with their needs.
From ETL to ELT
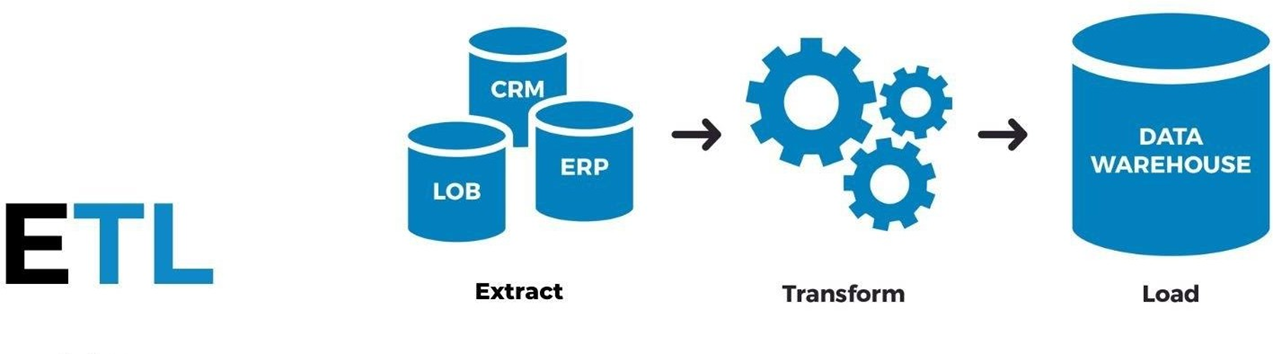
Traditionally, data architecture has been dominated by the ETL (Extract, Transform, Load) paradigm. In this model, data is first extracted from various sources, such as CRM systems, ERP systems, and external files like Excel spreadsheets. The extracted data is then transformed into a format suitable for analysis, often involving aggregation, cleaning, and enrichment. Finally, the transformed data is loaded into a data warehouse, where it can be accessed by business intelligence tools for reporting and visualization.
Example
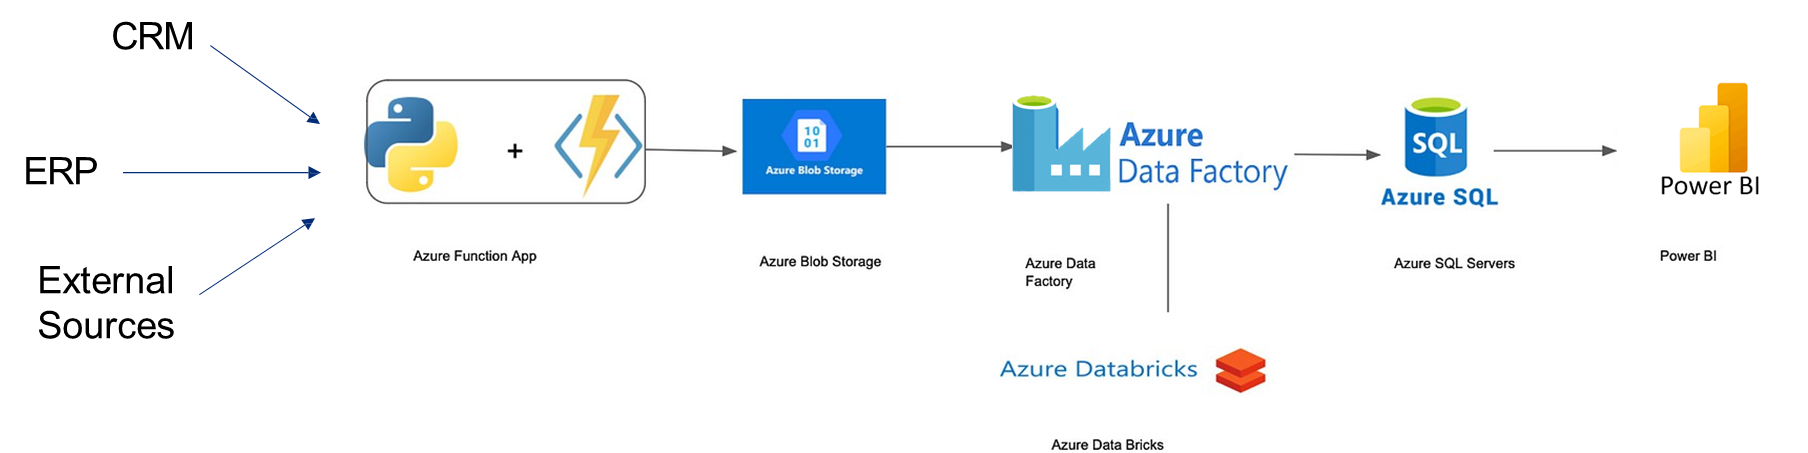
A real-world example of an ETL architecture involves the use of cloud-based tools like Microsoft Azure. In this scenario, data is extracted using Python scripts and Azure functions, transformed using orchestration tools like Azure Data Factory and Databricks, and loaded into an SQL data warehouse. The processed data is then visualized in Power BI, enabling business users to generate insights and make data-driven decisions.
However, the ETL paradigm has its limitations, particularly in the era of big data and artificial intelligence. One of the key challenges is that the transformation process often results in the loss of granularity, as data is aggregated to meet the immediate needs of business users. While this may be sufficient for basic reporting, it can hinder more advanced analytical tasks, such as machine learning and predictive modeling, which require access to raw, unaggregated data.
The Rise of ELT
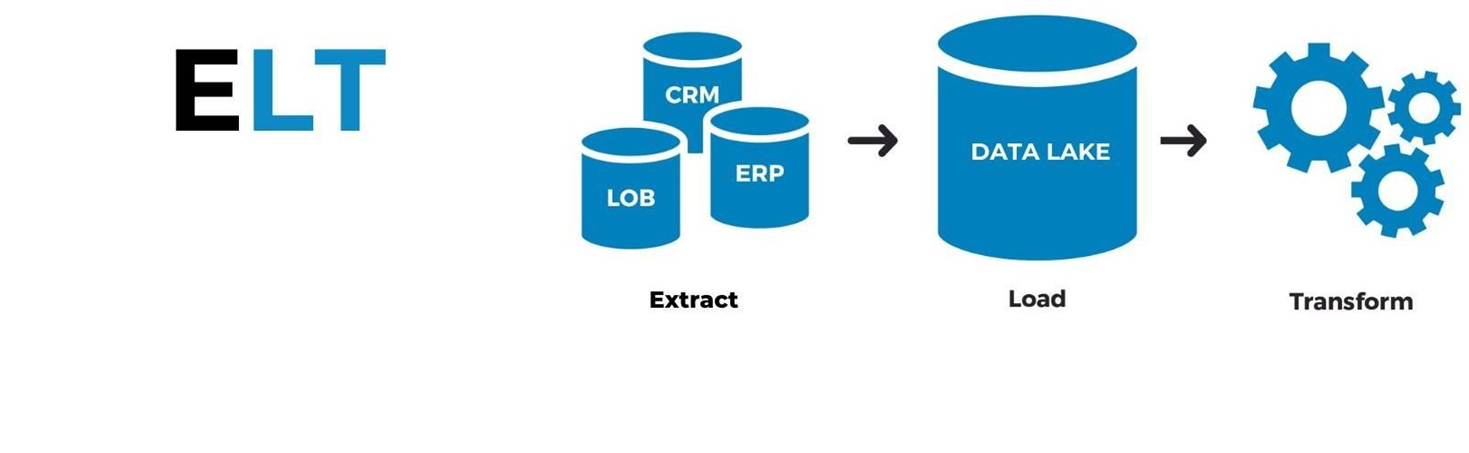
The ELT paradigm reverses the traditional sequence of operations, loading raw data into a storage system before applying any transformations. This approach is particularly well-suited to modern data environments, where the volume, variety, and velocity of data make it impractical to preprocess all data before storage. Instead, data is loaded into a data lake—a centralized repository that can store structured, semi-structured, and unstructured data in its native format. Once the data is stored, it can be transformed as needed to support specific use cases, such as business intelligence or machine learning.
Example
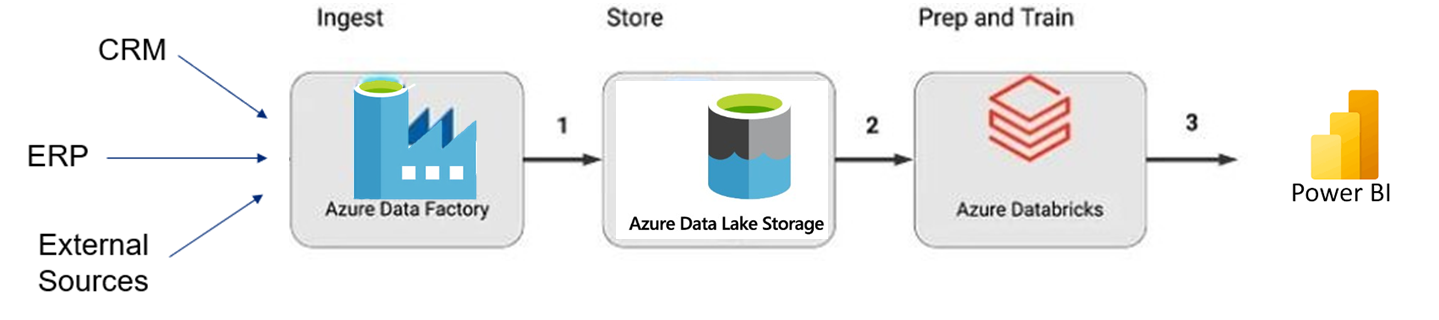
For example, in an ELT architecture, data might be extracted from company systems using Azure Data Factory and loaded directly into a data lake. From there, tools like Databricks can be used to transform the data into the required format for visualization in Power BI. At the same time, data scientists can access the raw data in the data lake to develop and train machine learning models.
Real-Time Analytics

Real-time analytics represents a significant advancement in the field of data architecture, enabling organizations to monitor and respond to events as they occur. While real-time data processing is not always a necessity in the business world, there are scenarios where it becomes a critical requirement.
Example
For example, industries such as food and beverage, healthcare, and manufacturing often rely on real-time data to ensure operational efficiency, safety, and compliance. In these contexts, the ability to track metrics like temperature, machine performance, or patient vitals in real time can have a direct impact on business outcomes.
However, implementing real-time analytics is not without its challenges. One of the primary hurdles is managing the complexity of integrating real-time data streams into existing data architectures. Traditional data architectures, which are often based on batch processing and ETL workflows, are not inherently designed to handle the continuous flow of data required for real-time analytics. To address this, modern data architectures often incorporate specialized components and technologies that enable real-time data ingestion, processing, and visualization.
A common approach to integrating real-time analytics into a data architecture involves combining traditional ELT workflows with dedicated real-time processing capabilities. For instance, a hybrid architecture might use ELT for batch processing and historical data analysis, while leveraging tools like Azure Event Hubs or Apache Kafka for real-time data ingestion. These tools enable the capture and processing of data streams from sources such as IoT devices, sensors, or transactional systems.
Once the data is ingested, it can be processed in near real time using stream processing frameworks like Apache Flink or Azure Stream Analytics. These frameworks allow organizations to perform complex computations on data streams, such as aggregations, filtering, and anomaly detection, before delivering the results to downstream applications or dashboards.
Near Real-Time Analytics
While true real-time analytics is achievable, it often comes with significant technical and financial costs. In many cases, near real-time analytics provides a practical alternative that balances performance and resource requirements. Near real-time systems process data with minimal latency, typically within seconds or minutes, rather than milliseconds. This approach is often sufficient for business applications where immediate action is not critical.
For example, Power BI, a popular business intelligence tool, allows users to refresh dashboards at regular intervals, such as once per hour. For businesses operating within standard working hours (e.g., 9 AM to 5 PM), this level of refresh frequency can provide near real-time insights without the need for complex infrastructure. By aligning data refresh schedules with business needs, organizations can achieve a balance between timeliness and cost-effectiveness.
Project Management in Data-Driven Initiatives
Once the data architecture is in place, the next step is to execute projects that leverage this architecture to deliver value. In the context of data, projects often involve the development of data products, such as reports, dashboards, or predictive models. These products are designed to address specific business needs, such as improving decision-making, optimizing operations, or enhancing customer experiences.
Project management plays a crucial role in ensuring the success of data-driven initiatives. Effective project management involves defining clear objectives, establishing timelines, allocating resources, and managing risks. In the consulting world, project management skills are particularly valuable, as consultants are often tasked with delivering complex data solutions within tight deadlines.
Data as a Product
A growing trend in the field of data architecture is the concept of “data as a product.” This approach treats data as a valuable asset that can be packaged and delivered to internal or external customers. Just as a physical product is designed, manufactured, and distributed, a data product is developed through a series of well-defined processes, including data collection, transformation, analysis, and visualization.
Example
For example, a retail company might develop a data product that provides insights into customer purchasing behavior. This product could include dashboards that visualize sales trends, predictive models that forecast demand, and APIs that enable integration with other systems.
Project Methodologies
Project management is a critical discipline that ensures the successful execution of tasks within a defined timeline to achieve specific goals.
Definition
A project, in its essence, is a structured set of activities aimed at accomplishing a particular objective or set of objectives.
Whether in academia, business, or technology, projects are ubiquitous, and their success often hinges on the methodology employed to manage them. Two of the most widely used project management methodologies are the Waterfall and Agile approaches. Each has its own strengths, weaknesses, and ideal use cases, making it essential for project managers to understand their nuances and apply them appropriately.
The Waterfall Methodology
The Waterfall methodology is one of the oldest and most traditional project management frameworks. It is characterized by its linear, sequential approach, where each phase of the project must be completed before the next one begins. This methodology is often visualized as a cascading flow, hence the name “Waterfall.” The process typically starts with project preparation, followed by analysis and design (often documented in a blueprint), realization (development), testing, and finally, deployment.
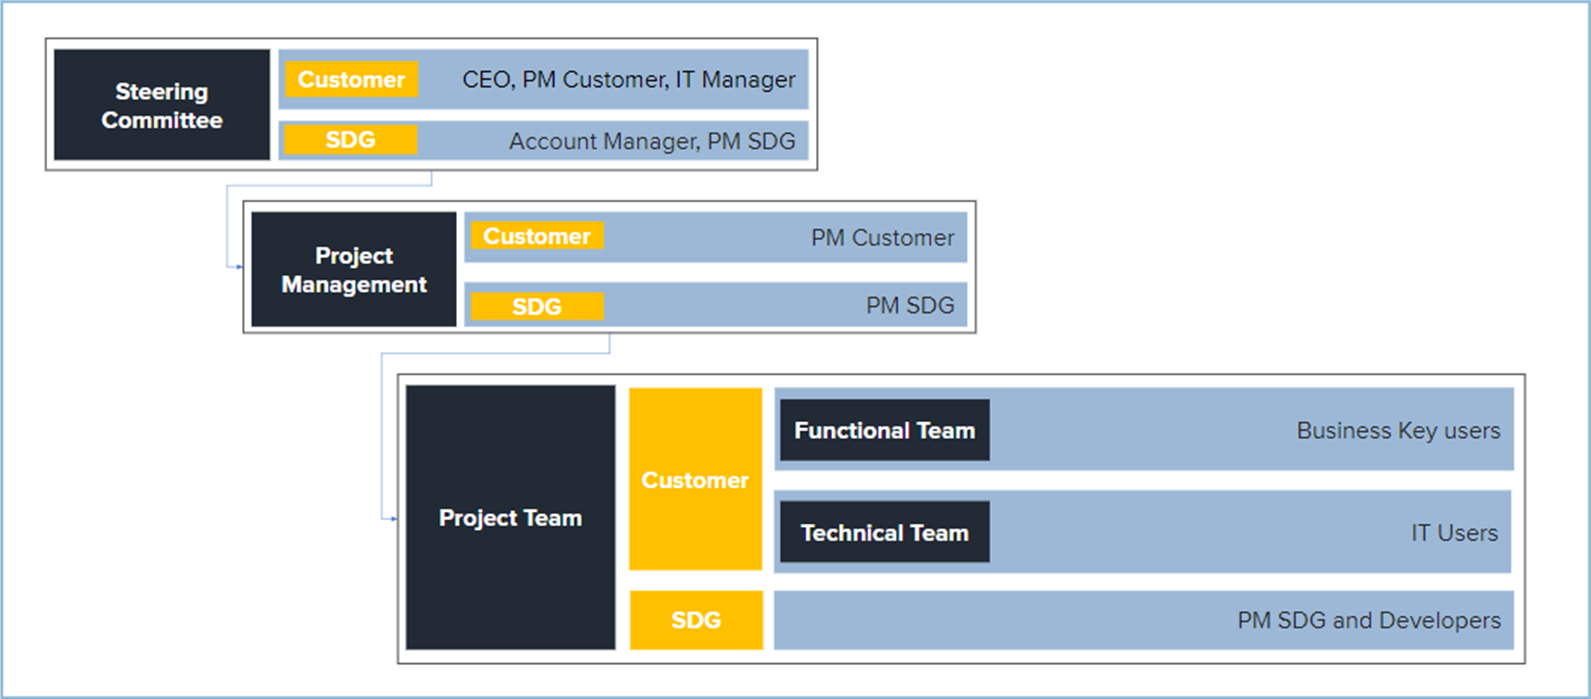
In a Waterfall project, the scope is defined upfront, and any changes to the scope during the project can lead to delays and increased costs. This rigidity makes Waterfall particularly suitable for projects with well-defined requirements and low uncertainty.
Example
For example, in a project to develop a data architecture for a company, the Waterfall approach might involve gathering requirements, designing the architecture, implementing it, and then testing it before deployment.
The blueprint document, which outlines the project’s scope, architecture, data model, security configurations, and testing procedures, serves as a critical reference throughout the project.
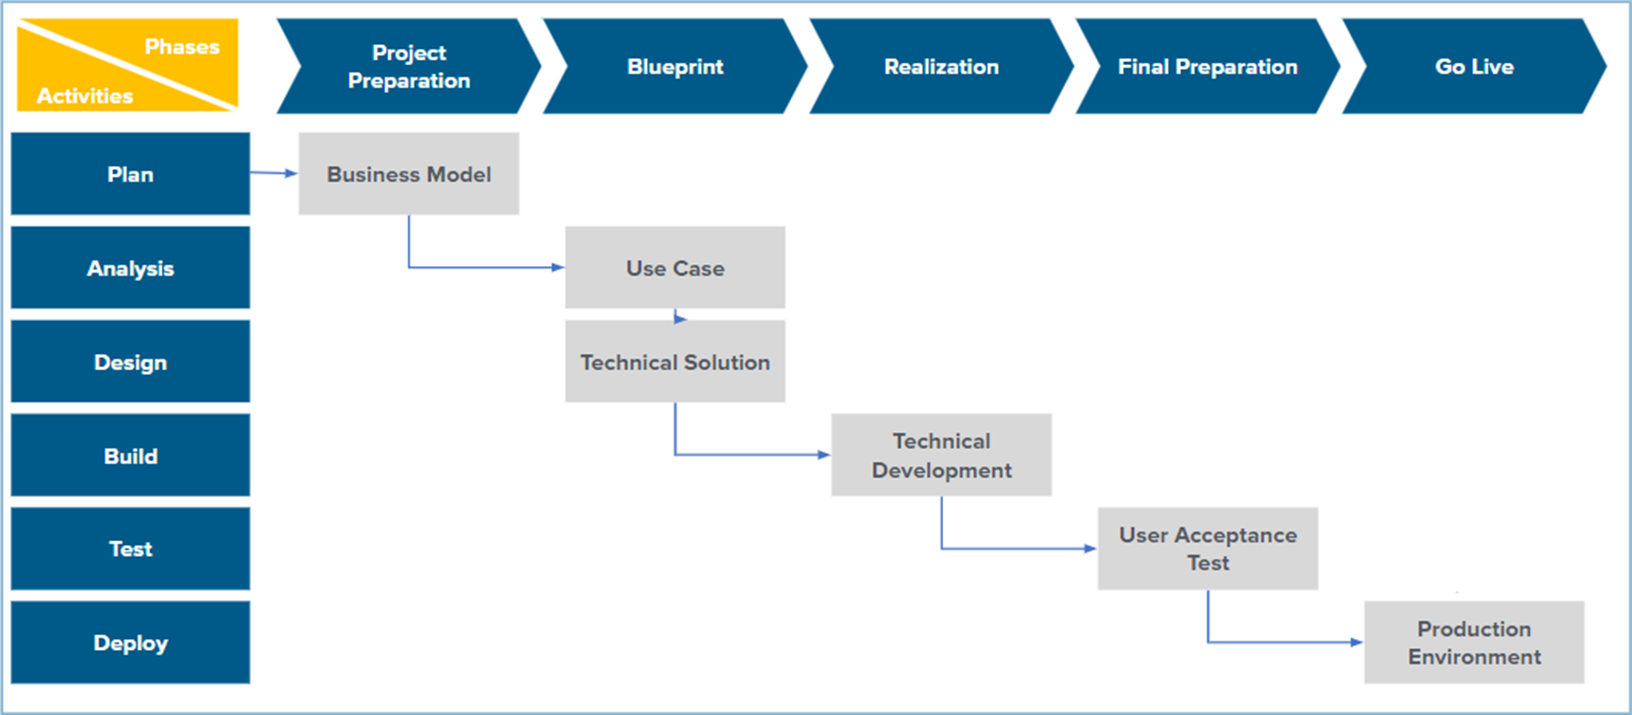
Waterfall projects are typically managed by a project manager who oversees the entire process, ensuring that each phase is completed on time and within budget. The project team usually includes technical developers, functional experts, and key stakeholders from both the client and the consulting side. Regular meetings, such as steering committee sessions, are held to review progress and make high-level decisions. While Waterfall is effective for predictable projects, its lack of flexibility can be a drawback in environments where requirements are likely to change.
The Agile Methodology
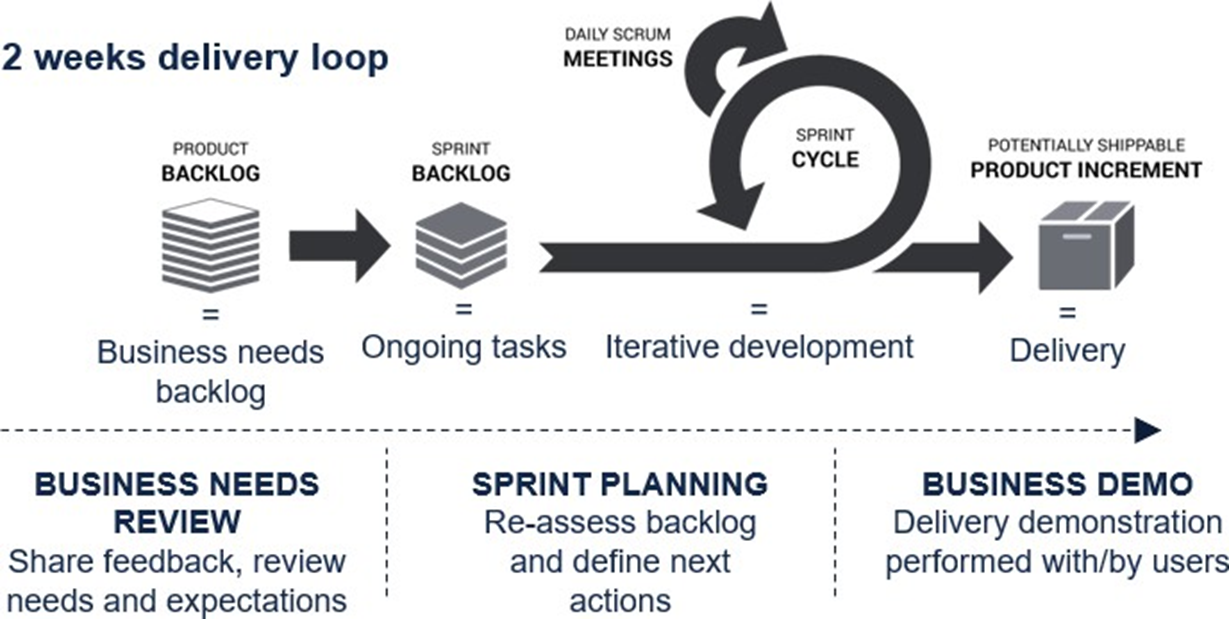
In contrast to Waterfall, the Agile methodology is designed to accommodate change and uncertainty. Agile originated in software development but has since been adopted across various industries, including data management and analytics. The core principle of Agile is iterative development, where projects are broken down into small, manageable increments called sprints. Each sprint typically lasts one to two weeks and results in a functional increment of the final product. Agile projects are characterized by their flexibility, with the scope evolving over time based on feedback and changing requirements. This approach is particularly useful in dynamic environments where business needs and technological landscapes are constantly shifting.
Choosing the Right Methodology
The choice between Waterfall and Agile depends on the nature of the project, the level of uncertainty, and the complexity of the requirements. Waterfall is ideal for projects with well-defined requirements and low uncertainty, such as setting up a data architecture or implementing a standardized process. Agile, on the other hand, is better suited for projects with high uncertainty and evolving requirements, such as developing a new data product or creating a dynamic reporting system.
In some cases, a hybrid approach may be the best solution. For example, a company might use the Waterfall methodology to set up its data architecture and then switch to Agile for the development of data visualization tools. This combination allows for the structured planning and execution of complex infrastructure projects while maintaining the flexibility to adapt to changing business needs during the development phase.
Scope, Time, and Cost

A fundamental concept in project management is the “Iron Triangle,” which represents the interplay between scope, time, and cost. In the Waterfall methodology, the scope is fixed, while time and cost are variable. This means that any changes to the scope can lead to delays and increased expenses. In Agile, however, time and cost are fixed, and the scope is variable. This allows teams to deliver incremental value within a set timeframe and budget, adjusting the scope as needed based on feedback and evolving requirements.
Quality is a non-negotiable aspect of both methodologies. Whether using Waterfall or Agile, the goal is to deliver a high-quality product that meets the needs of the stakeholders. However, the approach to achieving this goal differs. In Waterfall, quality is ensured through rigorous testing at the end of the project, while in Agile, quality is built into each sprint through continuous testing and feedback.
Requirement Gathering
Requirement gathering is often referred to as an “art” because it involves a delicate balance of technical expertise, interpersonal skills, and a deep understanding of the problem at hand. Despite its importance, this phase of a project is frequently undervalued and sometimes delegated to junior team members or rushed through without the attention it deserves. However, the success of any project hinges on the clarity and accuracy of its requirements. If the requirements are not well-defined at the outset, the project scope is likely to change, leading to delays, cost overruns, and ultimately, a failure to meet the customer’s needs.
The process of gathering requirements is not merely about documenting what the customer wants; it is about understanding the underlying problem they are trying to solve. When a customer requests a dashboard to visualize sales data, the real question is not about the dashboard itself but about the business challenge it aims to address. Is the goal to identify inefficiencies, optimize existing processes, or support strategic decision-making? By digging deeper into the “why” behind the request, project teams can ensure that the solution they deliver aligns with the customer’s true needs. This requires active listening, empathy, and the ability to ask the right questions, such as:
- What data is available?
- What are the key dimensions and metrics?
- How will the analysis be consumed?
- What is the required frequency of data updates?
Transforming Excel-Based Processes
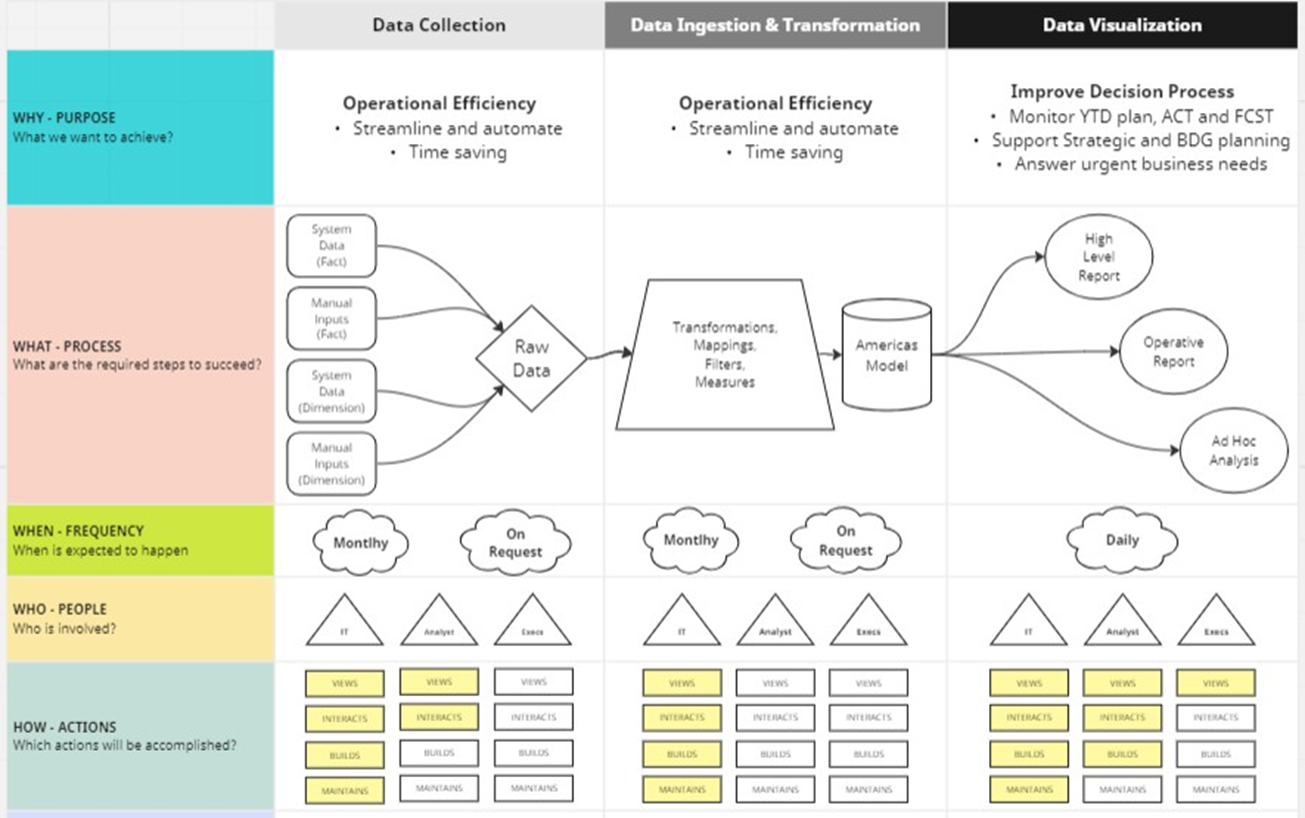
To illustrate the importance of requirement gathering, consider a real-world example from a 2024 project. The task was to transition a business team from relying on complex Excel files to a more streamlined, automated data process. The team spent significant time manually updating spreadsheets, which were slow to open and prone to errors. The goal was to automate this process, saving time and enabling the team to focus on analysis rather than data preparation. The project was divided into three phases: data collection, data ingestion and transformation, and data visualization. By working closely with the business team, the project team mapped out the entire process, identifying key stakeholders, data sources, and the frequency of data updates. This collaborative approach ensured that the final solution not only met the technical requirements but also addressed the team’s pain points, such as the need for flexibility and faster decision-making.
The Principle of “Garbage In, Garbage Out”
A fundamental principle in data management is “garbage in, garbage out,” which emphasizes that the quality of the output is directly dependent on the quality of the input. No matter how sophisticated the data architecture, algorithms, or visualization tools, if the underlying data is flawed, the results will be unreliable. This principle is especially relevant in the era of artificial intelligence, where machine learning models and generative AI systems rely heavily on high-quality data to produce accurate and meaningful outputs. Poor-quality data can lead to biased models, incorrect predictions, and ultimately, poor business decisions.
Data quality is a multifaceted discipline that encompasses both technical and business aspects. On the technical side, data quality involves ensuring that data adheres to predefined standards, such as correct data types (e.g., dates formatted as dates) and valid value ranges (e.g., prices within a reasonable range). On the business side, data quality involves applying domain-specific rules to detect anomalies or inconsistencies.
Data Modeling
Data modeling is a foundational process in data management that involves creating a structured representation of data to support analysis, reporting, and decision-making. It serves as the blueprint for how data is organized, stored, and accessed within a system. Effective data modeling ensures that data is consistent, accurate, and easily interpretable, enabling organizations to derive meaningful insights from their data.
There are several approaches to data modeling, each serving a specific purpose and providing unique benefits. The three primary forms of data modeling discussed here are the data dictionary, entity-relationship diagrams (ERDs), and the logical layer implemented in semantic models.
Data Dictionary
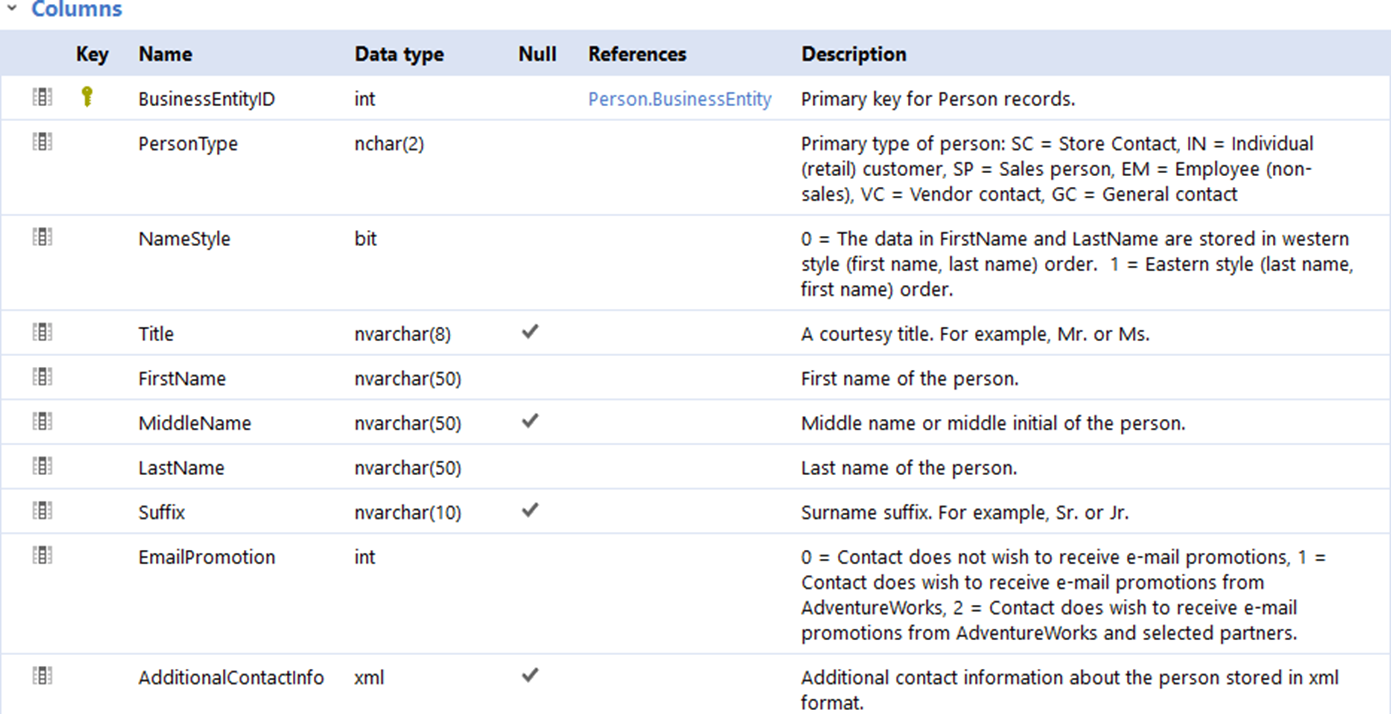
A data dictionary is a descriptive document that provides detailed information about the structure and meaning of data within a database. It typically includes fields such as column names, data types, and business definitions for each attribute in a table.
Example
For example, a data dictionary might specify that a column named
Customer_IDis of type integer and represents a unique identifier for each customer in the system.
This level of documentation is essential for ensuring that all stakeholders, from developers to business users, have a clear understanding of the data they are working with. A well-maintained data dictionary also facilitates data governance by providing a single source of truth for data definitions and usage guidelines.
Entity-Relationship Diagrams (ERDs)
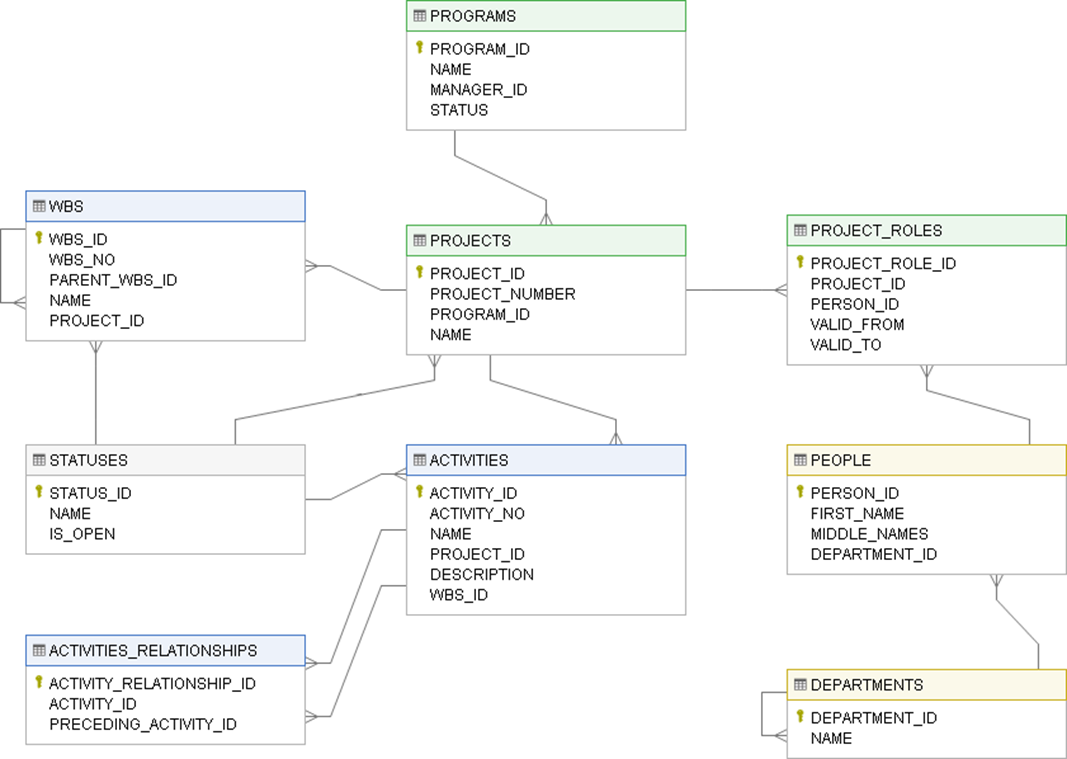
Entity-relationship diagrams (ERDs) are graphical representations of the logical structure of a database. They illustrate how different tables (entities) are related to one another through relationships, such as one-to-one, one-to-many, or many-to-many connections. ERDs are particularly useful for discussing data structures with business stakeholders, as they provide a visual framework for understanding how data flows and interacts within a system.
Example
For example, an ERD might show that a “Sales” table is linked to a “Customer” table through a
Customer_IDfield, indicating that each sale is associated with a specific customer.
Logical Layer and Semantic Models
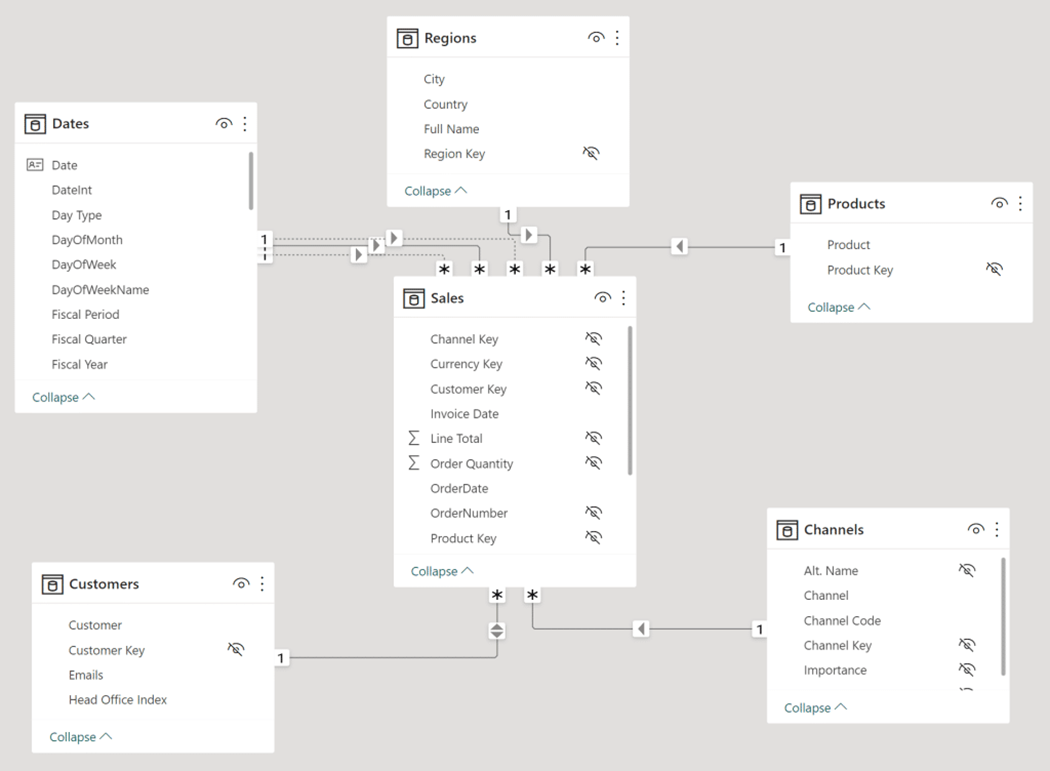
The logical layer, often implemented in semantic models, represents the physical realization of the data model. It defines the rules and relationships that govern how tables interact with one another in a database.
Example
For instance, in a Power BI semantic model, the logical layer specifies how a “Sales” fact table is related to a “Product” dimension table through a
Product_IDfield.
This layer is critical for enabling tools like Power BI to generate accurate and meaningful visualizations. By translating the logical relationships defined in an ERD into a physical implementation, the semantic model ensures that data is structured in a way that supports both analytical and operational needs.
Dimensional Modeling
A key concept in data modeling is the distinction between fact tables and dimension tables. Fact tables store quantitative data about events or transactions, such as sales figures or inventory levels. They typically contain foreign keys that link to dimension tables, which provide descriptive context for the data.
Example
For example, a “Sales” fact table might include fields like
Sale_AmountandSale_Date, along with foreign keys likeProduct_IDandCustomer_IDthat link to corresponding dimension tables.
Dimension tables, on the other hand, store attributes that describe the entities involved in the fact table, such as product names, customer details, or geographic locations. This separation of facts and dimensions is a cornerstone of dimensional modeling, which is widely used in business intelligence and data warehousing.
Normalization vs. Denormalization
Data modeling also involves decisions about normalization and denormalization.
- Use normalization when data integrity is a top priority, and you want to minimize data redundancy and avoid anomalies (insertion, update, and deletion anomalies). It is most suitable for transactional databases where data accuracy and consistency are crucial:
- Reduces data redundancy: Normalization splits data into separate tables to avoid duplicating the same information, which saves storage space and ensures consistency.
- Simplifies updates: With normalized data, you only need to update information in one place, reducing the risk of inconsistent data.
- Supports complex relationships: Normalization allows you to represent complex relationships between entities accurately. There are several normalization forms, including 1NF, 2NF, 3NF and so on, each with specific rules to achieve progressively higher levels of data integrity and reduced redundancy.
Example
For example, in a normalized model, a “Sales” table might only include a
Product_IDfield, with product details stored in a separate “Product” table. This approach ensures that updates to product information only need to be made in one place, reducing the risk of inconsistencies.
However, normalization can sometimes lead to complex queries that join multiple tables, potentially impacting performance.
- Use denormalization when you need to optimize query performance, especially for read-heavy workloads or reporting databases. It is suitable for cases where data redundancy is acceptable if it leads to significantly faster query execution.
- Improves query performance: By reducing the number of joins and minimizing the need to fetch data from multiple tables, denormalization can speed up data retrieval.
- Aggregations and reporting: Denormalized structures are often better suited for reporting and analytics because they can reduce the complexity of queries.
- Caching: Denormalization can facilitate data caching, which can further improve performance.
In practice, many databases use a combination of normalization and denormalization. You can selectively denormalize specific parts of the database to improve performance while keeping other parts normalized for data integrity.
Example
For example, a denormalized “Sales” table might include both
Product_IDandProduct_Namefields, eliminating the need to join with a “Product” table. While denormalization can improve query performance, it can also lead to data redundancy and increased storage requirements.
Data Visualization
Data visualization is the process of presenting data in a graphical or visual format to facilitate understanding and decision-making. While data modeling ensures that data is structured and organized, data visualization focuses on how that data is presented to end users. Effective data visualization requires an understanding of how the human brain processes information.
Different industries and use cases require different types of visualizations. The choice of visualization depends on the nature of the data and the insights that need to be communicated. Tools like Power BI, which has been consistently ranked as a leader in the business intelligence market by Gartner, provide a wide range of visualization options to meet these needs.