The concept of using technology to support better decision-making is fundamental in modern business management. Organizations often rely on different types of information systems to facilitate decision-making at various levels of the corporate hierarchy. These systems can be categorized into operational, administrative, and executive portfolios, each serving distinct functions based on the type of information they handle and the decisions they support.
Executive Portfolio
Definition
The executive portfolio is designed to assist top-level managers in making strategic decisions.
Unlike operational data, executive summaries contain aggregated insights that provide a high-level view of the organization’s performance. These reports are typically generated using data from operational systems, processed through data warehouses, and presented via dashboards or reports using business intelligence (BI) tools.
The primary role of the executive portfolio is to address the limitations of human cognitive capacity, commonly referred to as bounded rationality. Managers cannot process large quantities of data effectively, so they rely on concise and actionable summaries. Through visualizations, key metrics, and trend analysis, executives can assess the organization’s strategic alignment, identify potential risks, and make informed decisions. Additionally, artificial intelligence (AI) and machine learning algorithms are increasingly integrated into executive information systems to provide real-time insights, predictive analytics, and data-driven recommendations.
Anthony’s Pyramid
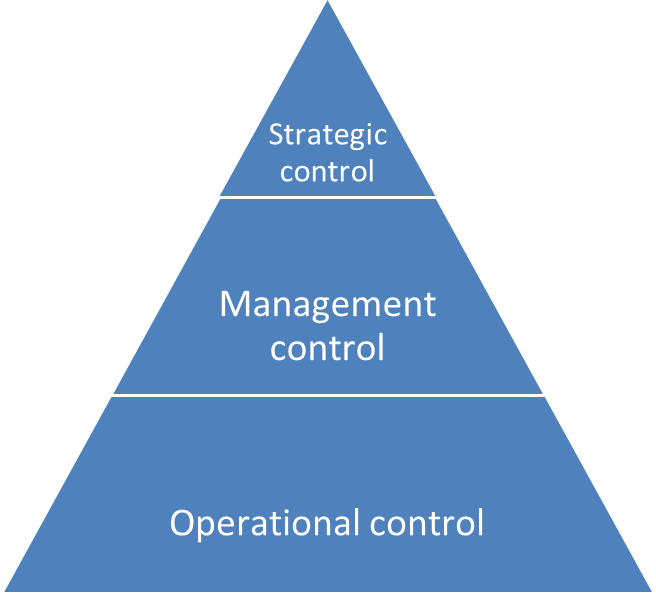
To further understand the relationship between different levels of decision-making, it is helpful to refer to Anthony’s Pyramid. Proposed by Robert N. Anthony, this conceptual model divides the organizational hierarchy into three distinct levels: Operational Control, Management Control, and Strategic Control. Each level serves a specific purpose and has unique information requirements.
-
Strategic Control: At the top of the pyramid, strategic control focuses on defining the long-term objectives of the organization. Decisions at this level involve determining which markets to enter, which products to develop, and how to allocate resources across business units. Strategic management relies on high-level summaries that provide an overview of the company’s performance across different regions and product lines.
-
Management Control: The middle layer of the pyramid involves management control, which is primarily concerned with ensuring that resources are used efficiently to achieve strategic objectives. Middle managers are responsible for budgeting, resource allocation, and performance monitoring. They require detailed financial reports, budget variance analyses, and resource utilization data to make informed decisions. This level often uses management information systems (MIS) to support budgeting, forecasting, and financial planning.
-
Operational Control: At the base of the pyramid, operational control involves managing day-to-day activities to ensure that processes run smoothly. Operational managers and supervisors oversee tasks such as production scheduling, quality control, and inventory management. They depend on real-time data from operational information systems to monitor workflows, address issues promptly, and optimize operational efficiency.
The flow of information within the organization follows a bidirectional pattern. As strategic decisions are made at the top, they cascade downwards in the form of operational plans and performance objectives. These plans are then executed at the operational level, where data is continuously generated. This data is subsequently aggregated and summarized as it moves upwards through the hierarchy, providing management and executive levels with a comprehensive overview of operational outcomes.
One of the key challenges in this process is ensuring that the summarized data remains accurate and relevant. Traditional reporting methods rely heavily on pre-defined metrics and static reports. However, advancements in AI, big data analytics, and real-time data processing now allow managers to query operational databases directly. AI-powered systems can analyze large datasets in real-time, detect patterns, predict future trends, and recommend optimal courses of action.
Similarly, AI-driven decision support systems (DSS) offer scenario analysis and simulation capabilities. Managers can input variables and explore the potential impact of different decisions, enhancing their ability to make informed choices under uncertainty.
Functional Map of Executive Information Systems
An Executive Information System (EIS) provides essential tools for senior management to monitor and analyze company performance across multiple dimensions. The system is organized into five primary functional areas, or lanes, each serving distinct purposes and supported by backend engines. These lanes facilitate the continuous cycle of planning, control, and decision-making within a business environment.
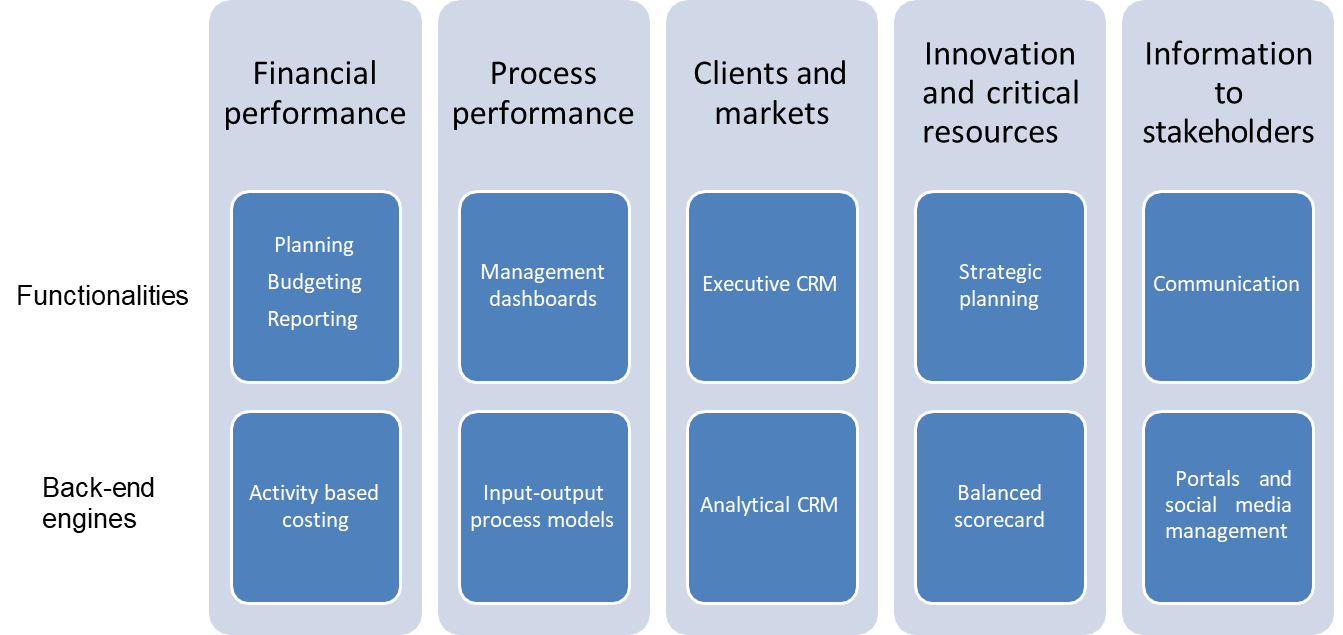
1. Financial Performance
The financial lane of the EIS focuses on analyzing financial data to evaluate the company’s monetary health. This includes tracking revenue, costs, profitability, and budget performance. Data from areas like production expenses, resource use, and sales revenue are summarized to provide a clear financial overview. Executives use this information to compare actual results with financial plans and take corrective actions when needed.
Financial dashboards and visual tools provide real-time insights into key metrics. Features like variance analysis and trend forecasting help predict future financial performance, enabling management to ensure the company stays on track with its long-term goals.
2. Process Performance
Monitoring process performance is essential for assessing the efficiency and effectiveness of internal operations, production cycles, and supply chain activities. Key performance indicators (KPIs) such as operational efficiency, production throughput, defect rates, and downtime help identify bottlenecks and inefficiencies.
By analyzing this data, managers can implement process improvement strategies like Lean or Six Sigma. Advanced analytics tools also assist in pinpointing root causes of inefficiencies, optimizing resource allocation, and predicting maintenance needs to minimize downtime and enhance overall productivity.
3. Client and Market
The client and market lane of an EIS focuses on understanding customer behavior and market trends. Key metrics like customer retention rates, net promoter scores (NPS), and customer lifetime value (CLV) help businesses evaluate satisfaction and loyalty.
Using predictive analytics, companies can forecast demand and identify new opportunities. AI-driven tools provide insights to guide marketing campaigns, product development, and market expansion strategies.
4. Innovation and Critical Resources
Innovation and resource management are key aspects of a modern EIS. Companies invest heavily in R&D projects, making it crucial to track progress and outcomes effectively. Metrics such as R&D spending, time-to-market, and milestone completion rates help executives evaluate project performance and make decisions to scale, pivot, or terminate initiatives.
AI-powered tools enhance decision-making by providing scenario modeling to predict the outcomes of different innovation strategies. Additionally, resource management features ensure efficient allocation of personnel, capital, and materials. Predictive models help identify potential bottlenecks, keeping projects on track and within budget.
5. Stakeholder Communication
Effective communication with stakeholders is a key role of an EIS. Stakeholders include shareholders, regulators, customers, employees, and the public. The system provides tailored reports and dashboards to meet their specific information needs, promoting transparency and accountability.
For shareholders, it delivers quarterly financial reports highlighting profitability, growth, and returns. For regulators, it ensures compliance through detailed legal and financial reports. External communication may include press releases on milestones, product launches, or sustainability efforts.
Modern data visualization tools enable dynamic, easy-to-understand reports, enhancing discussions in board meetings and investor presentations.
Control Models and Variables
Control models and their associated variables play a central role in monitoring and evaluating organizational performance. In an Executive Information System (EIS), these models are structured to gather and analyze data across various functional areas, providing valuable insights to decision-makers. Each function within a company has specific performance indicators that measure success, identify areas for improvement, and support strategic planning.
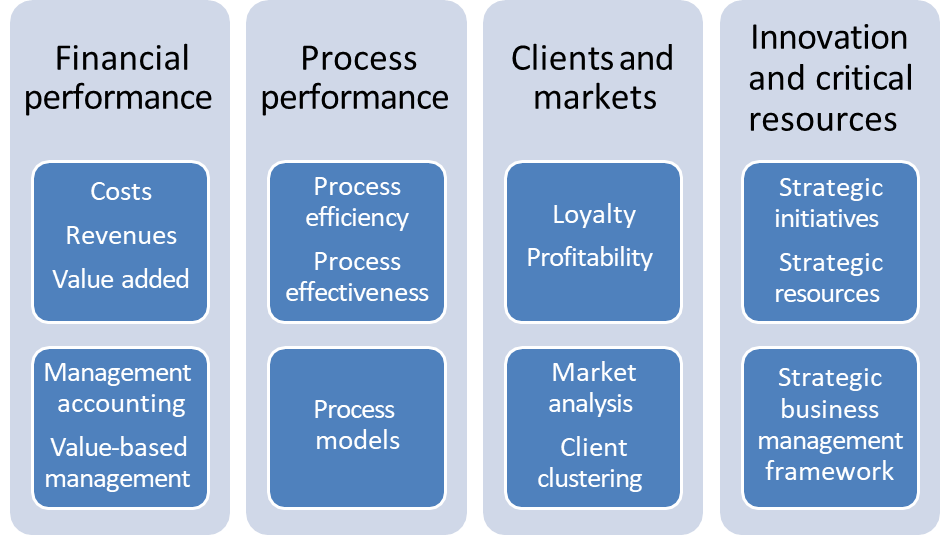
The primary control models in an EIS focus on distinct functional areas, each with its set of variables that serve as the foundation for generating performance indicators. These functional areas include:
-
Financial Performance:
Financial control models monitor variables such as costs, revenues, and added value. These variables provide a comprehensive view of the company’s financial health by tracking operational expenses, revenue streams, and the economic value generated through business activities. Chief Financial Officers (CFOs) rely heavily on financial indicators to ensure the company meets its financial goals, maintains budgetary discipline, and achieves sustainable profitability. -
Process Performance:
Process performance models assess the efficiency and effectiveness of internal operations. Efficiency measures how well resources are utilized to produce goods or services, while effectiveness evaluates whether the desired business outcomes are achieved. These indicators are crucial for operational managers, production supervisors, and quality control teams who aim to minimize waste, optimize resource utilization, and improve overall productivity. -
Client and Market Insights:
In the marketing and customer relationship management domain, variables such as customer loyalty and profitability are key. Customer loyalty is often measured through retention rates and satisfaction scores, while profitability considers the lifetime value of a customer. The Chief Marketing Officer (CMO) uses these indicators to assess the effectiveness of marketing campaigns, product positioning, and customer engagement strategies. -
Innovation and Resource Management:
Companies engaged in research and development (R&D) use innovation models to monitor progress and allocate resources effectively. Variables such as project completion rates, R&D spending, and resource utilization provide insights into the innovation pipeline. The Chief Innovation Officer (CIO) uses these indicators to determine which projects are progressing as expected and which may require adjustments in strategy or resource allocation.
Function-Specific Indicators
The concept of bounded rationality is critical when understanding how executives use control models. Bounded rationality refers to the cognitive limitations of decision-makers, meaning they cannot monitor every aspect of the business in real-time. Instead, they rely on aggregated and summarized information to make informed decisions.
To address this limitation, organizations derive Key Performance Indicators (KPIs) from control models. KPIs are the most relevant and actionable metrics that provide a quick assessment of whether a company is on track to meet its objectives. For instance:
- A CFO will prioritize KPIs like gross profit margin, operating cash flow, and return on investment (ROI).
- A CMO will monitor metrics such as customer acquisition cost (CAC), customer satisfaction index (CSI), and market share.
- A CIO may track time-to-market for new products, innovation ROI, and patent application rates.
While all performance indicators provide valuable information, KPIs are designated as “key” because they directly influence strategic decisions. Selecting the right KPIs is a deliberate process that involves aligning performance metrics with business goals. Managers ensure that the chosen indicators provide actionable insights rather than just generating excess data.
The Process of Extracting and Defining KPIs
The extraction and definition of KPIs from control models involve multiple steps. First, operational data is gathered from various sources, including enterprise resource planning (ERP) systems, customer relationship management (CRM) systems, and financial software. This data is then cleaned, aggregated, and processed to produce meaningful indicators.
Once the data is processed, algorithms and analytical models generate detailed reports and dashboards. These visual representations allow executives to monitor performance trends, detect anomalies, and predict future outcomes. Machine learning algorithms can further refine this process by identifying patterns and suggesting corrective actions.
Technology Architecture of Executive Information Systems
The technology architecture of an Executive Information System (EIS) is fundamentally structured to support data analysis and decision-making processes. At its core, the main enabling technology is the data warehouse.
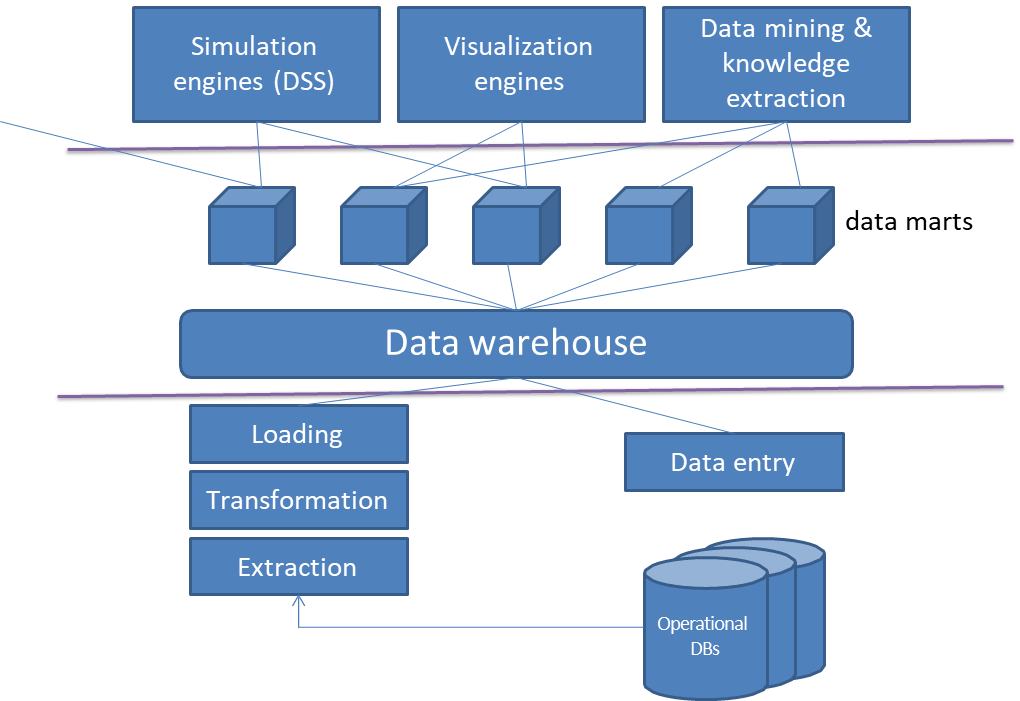
A data warehouse is a specialized database optimized for Online Analytical Processing (OLAP) rather than Online Transaction Processing (OLTP). While OLTP systems manage the real-time execution of business transactions, OLAP systems are designed to analyze large volumes of data, extract insights, and generate reports. The purpose of a data warehouse is to consolidate data from various operational sources, providing a centralized repository for historical and current information.
In the context of an EIS, the data warehouse serves as the primary data source for generating Key Performance Indicators (KPIs) and other decision-support metrics. Executives rely on these insights to monitor performance, identify trends, and make strategic decisions. Unlike transactional databases, which prioritize fast and reliable data updates, data warehouses are engineered for complex queries and data analysis.
OLAP vs. OLTP: Key Differences in Design and Functionality
The distinction between OLAP and OLTP is critical to understanding why data warehouses are used in EIS environments.
Online Transaction Processing (OLTP) systems are built to handle large numbers of simple transactions, such as order placements, payment processing, or inventory updates. These systems are optimized for fast data entry, retrieval, and update operations and follow the ACID (Atomicity, Consistency, Isolation, Durability) properties to ensure data integrity, especially in multi-user environments where concurrent transactions occur.
Online Analytical Processing (OLAP) systems, on the other hand, are designed for complex queries that involve aggregating and analyzing large datasets. These systems often relax certain ACID properties to enhance query performance. While ensuring consistency and durability remains essential, strict isolation and atomicity are typically unnecessary for read-only analytical operations. This trade-off significantly improves query response times, which is a core requirement for EIS.
Data warehouses are engineered using specialized data storage and management techniques to enhance OLAP performance. Key features include:
-
Data Aggregation and Summarization:
Data warehouses often pre-aggregate data to generate summaries, allowing executives to quickly access high-level performance metrics. For instance, instead of scanning millions of individual sales transactions, a data warehouse might store monthly or quarterly sales summaries. -
Dimensional Modeling and Star Schemas:
Data warehouses use multidimensional schemas such as Star Schema or Snowflake Schema to organize data efficiently. A star schema consists of a central fact table containing quantitative data (e.g., sales revenue) and multiple dimension tables that describe various aspects of the data (e.g., time, location, product). This design simplifies query execution and accelerates analytical operations. -
Data Extraction, Transformation, and Loading (ETL):
The ETL process is essential in data warehouse architecture. It involves extracting data from operational systems, transforming it into a standardized format, and loading it into the data warehouse. This ensures that the data is clean, consistent, and optimized for analysis. -
Read-Optimized Storage:
Unlike transactional databases that focus on write operations, data warehouses prioritize read performance. Techniques such as columnar storage and data partitioning are employed to accelerate analytical queries. -
Support for Complex Queries and Data Mining:
Data warehouses support SQL-based analytical queries, multidimensional analysis, and data mining algorithms. Executives can perform complex calculations, generate predictive models, and visualize trends using business intelligence (BI) tools integrated with the data warehouse.
A key characteristic of data warehouses is their ability to relax some of the traditional ACID properties to achieve higher query performance. While transactional systems enforce strict ACID compliance to ensure data integrity, analytical systems often operate in read-only modes where immediate consistency is unnecessary. This means:
- Atomicity and Isolation are less critical because there are no competing write operations.
- Consistency is maintained through periodic updates and batch processing rather than real-time synchronization.
- Durability remains essential to ensure data is permanently stored and retrievable.
Challenges of Querying Operational Databases Directly
Attempting to extract analytical data directly from operational databases poses several challenges. First and foremost is the issue of performance. Running complex queries on a transactional database can severely impact its ability to process real-time transactions. Operational databases are often designed to handle high volumes of small, quick transactions, but long-running analytical queries can lock data resources, creating bottlenecks and reducing system performance.
Additionally, operational databases often use normalized schemas to minimize data redundancy and ensure data integrity. While this design is optimal for transactional operations, it is inefficient for analytical queries, which may require extensive joins and aggregations. Furthermore, operational databases are typically distributed across different locations and may use varying technologies, further complicating the process of consolidating data for analysis.
Data Lakes and Their Limitations
In recent years, some organizations have adopted data lakes as an alternative to traditional data warehouses.
Definition
Data lakes store raw, unstructured, and semi-structured data from various sources, making them suitable for applications involving machine learning, artificial intelligence, and big data analytics. While data lakes offer flexibility and scalability, they are not without challenges.
One of the primary issues with data lakes is resource contention. Unlike a data warehouse, which isolates analytical workloads from transactional operations, a data lake may attempt to handle both simultaneously. For instance, if a large-scale machine learning model is being trained using the same data lake that supports real-time transactional queries, the system’s resources may become overwhelmed. This can lead to significant performance degradation, as was the case in some organizations where unsegregated resource management resulted in system-wide downtime.
Another limitation is the lack of standardized schema management in data lakes. Without proper governance and data quality controls, data lakes can quickly become data swamps—repositories of disorganized and unusable data. In contrast, a data warehouse imposes strict data modeling and quality assurance measures, ensuring that data remains clean, consistent, and reliable for analytical purposes.
Design Steps of Executive Information Systems (EIS)
Executive Information Systems (EIS) are designed to provide senior management with actionable insights through Key Performance Indicators (KPIs). A well-structured EIS relies on a systematic approach to defining, measuring, and presenting KPIs in a way that supports decision-making.
1. Defining KPIs and Their Dimensions
KPIs are quantifiable metrics that reflect business performance, but their values are not absolute—they depend on contextual dimensions. For example, “sales” as a KPI is meaningless without specifying:
- Temporal dimension (e.g., monthly sales in February 2025),
- Organizational dimension (e.g., sales by a specific department),
- Product dimension (e.g., sales of Product A),
- Geographical dimension (e.g., sales in Italy),
- Customer segment dimension (e.g., sales to corporate clients),
- Distribution channel dimension (e.g., online sales).
Only when all relevant dimensions are defined can the KPI’s value be accurately determined. This structured approach allows for drill-down (disaggregating data for granular analysis) and roll-up (aggregating data for high-level summaries). For instance, yearly sales can be broken down into monthly figures, or regional sales can be aggregated into national totals. These operations are typically arithmetic (summation, averaging) and must be performed in real time to support dynamic decision-making.
2. Data Warehouse Structure: Fact Tables and Dimension Tables
In a data warehouse, KPIs are stored using a star schema, which consists of:
- Fact tables: Contain numerical measurements (e.g., sales revenue, units sold) at the most granular level.
- Dimension tables: Store descriptive attributes (e.g., time periods, product categories, regions) that contextualize the facts.
Example
For example, in a retail setting:
- A fact table might record individual transactions (e.g., a customer’s purchase on a specific date).
- Dimension tables would list products, stores, customers, and time periods, allowing for multi-dimensional analysis.
This separation enables efficient querying and aggregation. Additionally, derived KPIs (e.g., “sales per employee”) can be computed by joining fact tables with dimension tables (e.g., dividing total sales by the number of sales personnel in a given unit).
3. Data Processing and Presentation Layer
Once KPIs are structured, they must be presented in an intuitive format for executives. This involves:
- Predefined dashboards: Designed in collaboration with managers to display key metrics in charts, tables, and trend visualizations.
- Self-service analytics: While most executives prefer preconfigured reports, some may need ad-hoc access to raw data for deeper investigation.
- Advanced analytics integration: Predictive models (e.g., sales forecasts) or optimization results (e.g., budget allocations) can be embedded into dashboards, though the underlying computations are typically handled by data scientists rather than end-users.
4. Challenges in EIS Implementation
A common issue in EIS deployment is fragmentation—multiple dashboards sourced from disparate systems due to legacy architectures or phased digital transformations. Ideally, an EIS should consolidate data into a unified view, but in practice, companies often layer new systems over old ones, leading to inefficiencies. A comprehensive overhaul (e.g., ERP migration or cloud-based analytics adoption) may be required to achieve full integration.
Wholesale Alfa Case Study
In this case study, we explore a scenario involving Wholesale Alfa, a large wholesale company operating with
Information Sources
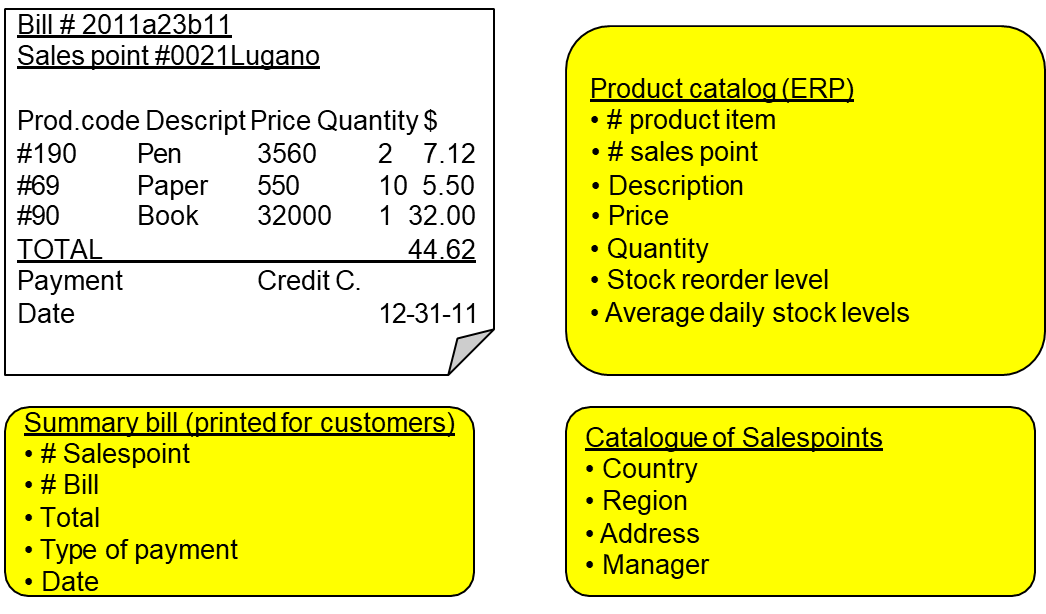
The data feeding into the data warehouse originates from multiple operational systems, each fulfilling distinct business functions. Notably, Enterprise Resource Planning (ERP) systems provide operational data, capturing product movement, inventory management, and order processing. Additionally, Customer Relationship Management (CRM) systems contribute insights into sales and customer interactions, while older, legacy applications remain integral for managing historical data.
Administrative systems are another vital source, contributing financial information such as payment records and outstanding balances. For instance, cash payments and pending transactions are managed within the administrative portfolio. These diverse data sources require careful extraction and consolidation to ensure seamless integration into the data warehouse.
Data Processing
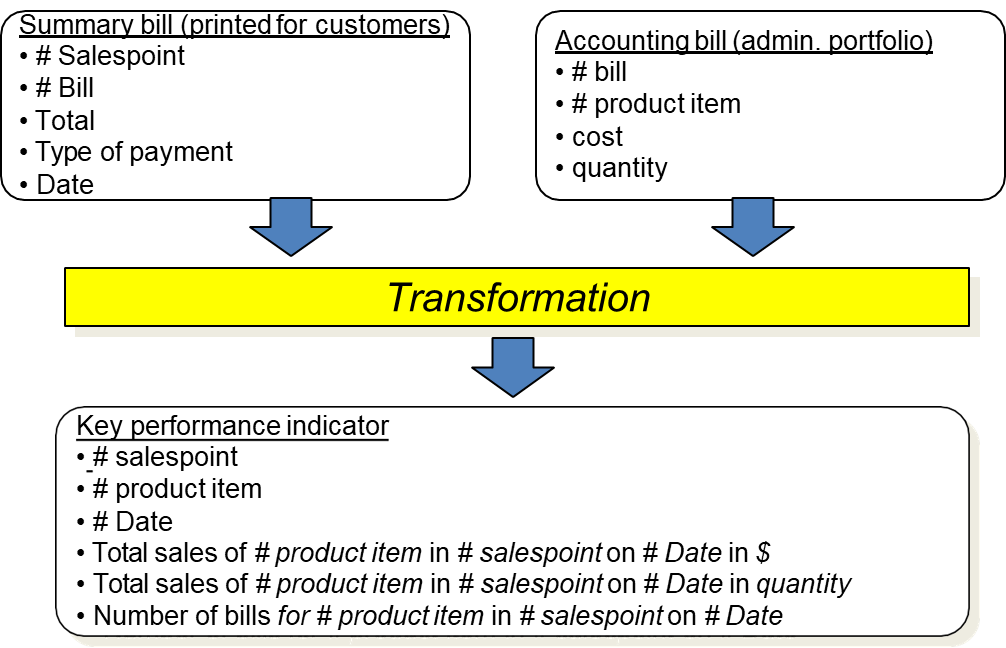
Once the data sources are identified, the next step is to execute the Extract, Transform, Load (ETL) process. During extraction, raw data is pulled from operational databases. The transformation phase involves cleaning and standardizing the data, resolving inconsistencies, and aligning it with a common schema. Business logic is applied to generate key insights, including sales aggregation, revenue calculations, and product performance metrics.
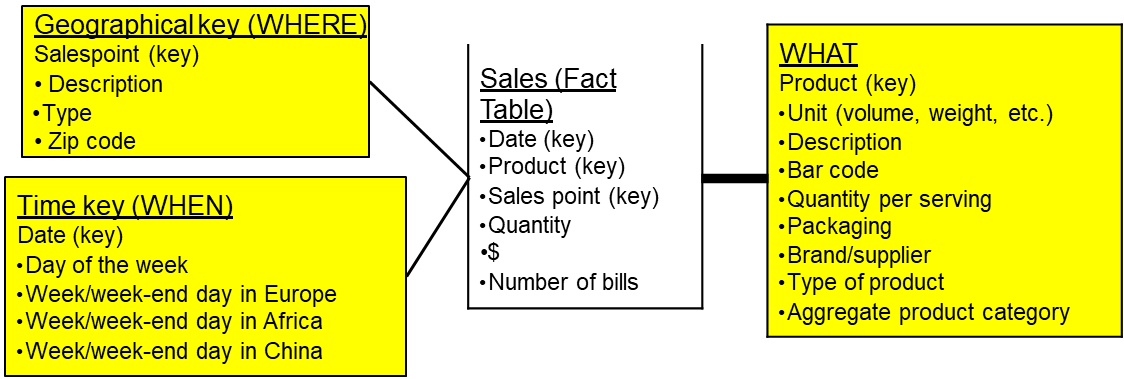
At the core of the data warehouse lies the fact table, storing transactional data such as sales figures. Each record in the fact table is uniquely identified using foreign keys that reference associated dimension tables. Dimension tables provide descriptive attributes like product details and sales point information. For example, a Product Catalog may include product names, categories, and pricing, while a Sales Point Catalog contains geographical and operational data of individual sales locations.
Information Storage
Following the integration and transformation process, data is stored in the data warehouse. Efficient storage solutions are required to manage the substantial volume of data, particularly when daily sales information across thousands of products and locations is captured over a two-year period.
Data storage involves not only housing the extracted information but also ensuring data refresh mechanisms are in place. In many cases, sales data is updated daily to maintain the accuracy of reports and dashboards. Automated processes are configured to detect and incorporate new records, ensuring that the data warehouse remains up-to-date.
Data Warehouse Design
The design phase focuses on structuring the data warehouse to meet analytical and reporting needs. Popular data warehouse management tools like Oracle Data Integrator (ODI), Talend, or KNIME are often employed for this purpose. These platforms offer visual interfaces that simplify data integration and ETL pipeline management. Users can connect to multiple data sources, browse database schemas, and select the relevant tables and columns for extraction.
Example
Oracle, for example, supports the automatic generation of fact and dimension tables once the source data is conceptually integrated. The system can perform complex data transformations and create the final data warehouse schema. This automation accelerates the development process, reducing manual intervention while ensuring consistency and accuracy.
Moreover, data warehouse systems often implement partitioning and indexing techniques to enhance query performance. Partitioning enables large datasets to be divided into smaller, manageable segments based on time or other attributes. Indexing further optimizes query execution, reducing response times for analytical workloads.
Data Processing in a Data Warehouse Environment
At the processing level of a data warehouse, the primary objective is to analyze and interpret data using specialized engines. These engines are capable of conducting various types of analyses, including drill-down or roll-up operations, which allow users to view data at different levels of granularity. For instance, a manager may want to analyze overall sales performance across the company or focus on specific products at particular sales points. These operations are often performed using Online Analytical Processing (OLAP) tools, which provide a flexible and interactive approach to data exploration.
Data is typically updated daily to ensure timely and accurate reporting. This daily update cycle allows decision-makers to monitor business performance using the most recent data. However, when more complex analysis is required, companies may rely on additional analytical tools that offer advanced capabilities.
Designing and Distributing Reports
Once the data processing is complete, the next step involves generating reports to communicate insights effectively. Data warehouse platforms typically provide integrated reporting tools that allow users to create customized dashboards and visualizations. Tools such as Oracle BI, Tableau, and Power BI enable users to select relevant data, apply filters, and present findings in a visually appealing format.
Reports can be scheduled for automatic generation and distribution and can be sent via email, published in shared workspaces, or integrated into organizational collaboration platforms like Microsoft Teams or Slack.
Low-Code and No-Code Tools for Data Analysis
For organizations without extensive technical resources, low-code and no-code tools provide a simplified method of conducting data analysis. These tools offer graphical user interfaces that minimize the need for coding, making them accessible to users with limited programming knowledge. They often support tasks like data visualization, basic machine learning models, and automated report generation.
However, low-code platforms are generally not designed for handling large-scale datasets. While they may offer quick insights for smaller datasets, their lack of scalability becomes evident when dealing with terabytes of data. Furthermore, these tools often apply default algorithms without extensive model tuning, which can lead to suboptimal results.
Some low-code platforms offer automated machine learning capabilities, allowing users to apply multiple models and select the one with the best performance. They may include models like random forests, neural networks, or support vector machines (SVM). While these features are useful for simple classification or regression tasks, users may face limitations when attempting to fine-tune hyperparameters or address data quality issues.
Challenges of Data Scalability
Scalability remains one of the biggest challenges when using low-code and no-code tools. Many platforms struggle with datasets exceeding 1 GB in size, leading to performance bottlenecks or system failures. Even if the tools claim to support larger datasets, they often lack the computational efficiency necessary for processing complex data.
Some users might attempt to mitigate these issues by applying data sampling techniques — reducing the dataset to a smaller, manageable size. While this approach reduces processing time, it introduces significant limitations. Sampling can lead to the loss of statistical significance and introduce bias. Additionally, sampling ignores critical factors like seasonality and long-term trends.
Automated Model Selection and Hyperparameter Tuning
In modern data analysis, the concept of a data science machine has gained prominence. This idea, introduced in visionary research papers, advocates for the automated selection and fine-tuning of machine learning models. Instead of relying on a single algorithm, the system evaluates multiple models on the given data, identifies the most accurate one, and optimizes its hyperparameters. Libraries such as AutoML in Python have made this concept more accessible.
However, automated model selection is not without its challenges. While it can save time in exploratory tasks, the lack of transparency in the selection process means users might not fully understand why a particular model was chosen. Furthermore, models trained on small, clean datasets may perform well initially but fail when exposed to real-world data with noise, missing values, or outliers.
Real-World Limitations of Low-Code Tools
A practical example of the limitations of low-code platforms can be seen when working with categorical variables. Some tools, like KNIME or Alteryx, may infer data types by analyzing the first few thousand rows of a dataset. If a variable contains rare categories that do not appear within the sample, the tool may misinterpret the data type, leading to errors during analysis.
Organizations relying solely on low-code tools may face severe productivity losses if these limitations are not addressed. While low-code platforms are beneficial for prototyping and conducting exploratory data analysis, they are not suited for enterprise-level tasks that involve complex data engineering and large-scale machine learning.
Critical Success Factors (CSF) Method
When designing a data warehouse and its corresponding executive information system (EIS), one of the most critical challenges is selecting which Key Performance Indicators (KPIs) should be stored and represented. KPIs, such as total sales, sales per salesperson, or regional sales growth, are fundamental for monitoring business performance. However, determining the appropriate KPIs is not a straightforward task.
KPI Selection
Selecting KPIs is rarely a matter of simply extracting data from operational databases. Instead, it is a complex analytical process that involves understanding the business landscape, the availability of data, and the frequency with which data can be updated. Some companies might claim to have real-time sales data, but in practice, their “real-time” may refer to a delay of several hours or even days. Moreover, discrepancies in data availability often occur, particularly when integrating data from international branches or third-party providers.
The quality and granularity of the data are additional factors to consider. Some metrics may be available only as aggregated data, while others might lack consistency due to delayed or incomplete updates. Therefore, the analyst’s role is to assess the feasibility of obtaining accurate, timely, and relevant data. Regular communication with technical teams is necessary to understand these limitations and set realistic expectations.
A purely technical perspective is insufficient for determining KPIs. This is where the concept of Critical Success Factors (CSFs) becomes essential: CSFs are the key areas in which a business must excel to achieve its strategic objectives. Unlike KPIs, which are quantifiable measures, CSFs are often broad, qualitative concepts such as “customer satisfaction,” “operational efficiency,” or “market leadership.”
The CSF Method
The CSF Method provides a systematic approach to bridge the gap between high-level business objectives and the measurable KPIs needed for decision-making. The process involves four main steps:
Steps
Predefinition:
Before engaging with stakeholders, analysts conduct a desk analysis to gather background information about the company. This includes reviewing public documents, financial reports, competitor analysis, and social media sentiment.Interviews with Top Management:
The next step involves discussions with senior managers to identify their strategic priorities and concerns. Unlike technical staff, managers often speak in abstract terms, focusing on strategic goals rather than measurable indicators. Analysts must interpret these discussions to infer the underlying CSFs.Robustness Analysis:
Following the interviews, analysts validate and refine the identified CSFs. This involves cross-referencing the proposed CSFs with external benchmarks and industry standards. Additionally, analysts may conduct follow-up discussions to ensure alignment and feasibility.Refinement and Documentation:
The final step involves creating detailed documentation that outlines the identified CSFs, the associated KPIs, and the rationale behind these choices. This documentation serves as a foundation for the development of dashboards and reports within the EIS.
Technical Feasibility
One of the major challenges in applying the CSF method is balancing the aspirations of business managers with technical feasibility. Managers often propose ambitious KPIs without considering data limitations. For example, they might request real-time insights into customer satisfaction across all regions, while the available data is updated only weekly.
In such cases, the role of the analyst is to propose alternatives. This could involve offering a range of feasible KPIs that approximate the desired insights or suggesting phased implementations that gradually enhance data accuracy and update frequency. The key is to facilitate informed decision-making rather than making unilateral choices.
During the implementation phase, it is common for unforeseen challenges to arise. Even if KPIs are well-defined and aligned with business goals, data integration, quality issues, and technical bottlenecks may cause delays. Flexibility and proactive problem-solving are essential at this stage.
Furthermore, ongoing communication with both business and technical teams is crucial. Feedback loops should be established to ensure that the delivered KPIs remain relevant and actionable. Regular monitoring and adjustments help maintain the accuracy and usefulness of the dashboards.