In recent years, data analytics has emerged as a central pillar in both academic curricula and industry practice. While the topic is not new, it remains highly relevant today, particularly as organizations continue to face challenges in managing and extracting value from large-scale datasets.
Definition
The notion of “big data” is not just a buzzword; it refers to the massive volume, variety, and velocity of data being generated in modern digital ecosystems.
The convergence of data availability and scalable computing infrastructures has sparked innovations in data analytics, making it a suitable subject for academic inclusion alongside other mature fields like Cloud Computing.
The widespread interest in analytics is driven by its close association with artificial intelligence (AI) and Machine Learning (ML). Businesses are increasingly interested in developing systems that are not only data-aware but also capable of making intelligent decisions based on historical patterns. The rise of analytics is relatively recent, with the term gaining mainstream traction over the past decade. Yet, it remains topical because many enterprises are still grappling with how to scale analytics effectively across organizational units. The evolution of analytics aligns with advancements in computing power, data storage, and algorithmic sophistication, making it a critical subject of study in the context of digital transformation.
Artificial Intelligence (AI)
Artificial Intelligence is a broad and foundational concept that refers to the simulation of intelligent behavior by machines. It encompasses a wide array of subfields, from rule-based systems to more advanced paradigms such as machine learning, natural language processing, and robotics. AI aims to equip machines with capabilities traditionally associated with human intelligence, including reasoning, planning, perception, language understanding, and decision-making.
Definition
The formal definition of AI is often framed as “the intelligence demonstrated by machines, as opposed to the natural intelligence displayed by humans and animals.”
For example, early AI research focused on symbolic logic and expert systems, while modern AI increasingly relies on statistical models and data-driven approaches. The resurgence of interest in AI in recent years is largely attributed to improvements in computational infrastructure and the vast amounts of data now available for training intelligent systems.
Machine Learning (ML)
Machine Learning is a specialized subset of AI that focuses on enabling machines to learn from data without being explicitly programmed. Rather than coding rules manually, ML models are trained using datasets that contain input-output pairs. Through this training process, the model learns to map inputs to outputs and can generalize to make predictions on unseen data.
One of the fundamental distinctions between traditional software and ML systems lies in determinism.
- A traditional algorithm executes the same way every time, providing identical outputs for the same inputs.
- A machine learning model may produce slightly different outputs on different runs, especially in probabilistic models or when randomness is involved in the inference process.
This non-deterministic behavior introduces an element of unpredictability, which can pose challenges when deploying ML systems in critical enterprise applications that demand high reliability and consistency.
The presence of error is intrinsic to machine learning. Therefore, a crucial question arises: is the margin of error acceptable for the intended use case? This consideration is vital when deciding whether to deploy ML in domains like healthcare, finance, or autonomous systems, where even small inaccuracies can have significant consequences.
The current prominence of ML in enterprise applications is not only the result of algorithmic improvements but also due to the historical accumulation of digital data. Over the decades, organizations have progressively digitized their operations. Initially, from the 1960s to the early 2000s, the focus was on automating core business processes and storing operational data in structured formats. This phase laid the groundwork for the subsequent application of data-driven technologies.
Machine learning requires historical datasets to train models that can make accurate forecasts or classifications. Without such historical depth, ML applications may suffer from poor performance due to insufficient training examples. Thus, the digitization and maturity of enterprise information systems have been essential enablers of machine learning adoption.
Supervised vs. Unsupervised Learning
Machine learning training methods can be broadly categorized into supervised and unsupervised learning.
| Supervised Learning | Unsupervised Learning | |
|---|---|---|
| Definition | Models are trained on labeled datasets, where each input is paired with a correct output. | Models learn from unlabeled data, identifying patterns or structures without explicit guidance. |
| Advantages | High accuracy and interpretability; well-suited for tasks with clear labels. | More scalable and cost-effective; can uncover hidden structures in data. |
| Disadvantages | Requires large amounts of labeled data; expensive and time-consuming to create. | Less precise; may require additional post-processing or validation. |
| Use Cases | Predictive modeling, regression analysis | Market segmentation, exploratory data analysis |
| Examples | Classification tasks (e.g., spam detection, medical diagnosis) | Clustering tasks (e.g., customer segmentation, anomaly detection) |
Another relevant approach is semi-supervised learning, where a small portion of labeled data is used in combination with a large volume of unlabeled data. This hybrid technique is particularly useful in domains where labeling data is expensive or infeasible.
Core Problems in AI Research
Traditional AI research encompasses a wide range of technical challenges, including reasoning, knowledge representation, planning, learning, and perception. Some of the most notable AI capabilities today include speech recognition, strategic game-playing, autonomous vehicles, content recommendation systems, and robotics. Although the roots of AI can be traced back many decades, its commercial viability has fluctuated over time, often influenced by breakthroughs in computational methods and data availability.
One recurring limitation in practical ML deployment is the availability of high-quality labeled data—also known as “ground truth.” In many enterprise contexts, collecting or constructing a reliable ground truth can be prohibitively expensive or even impossible. When the data is noisy, incomplete, or inconsistent, the performance of machine learning systems suffers. Therefore, the creation of annotated datasets remains a bottleneck in many real-world applications.
Building a high-quality ground truth is one of the most demanding aspects of deploying supervised learning in enterprise contexts. Typically involves manual annotation, which is not only time-consuming and expensive but also susceptible to human error. When the ground truth is flawed, the trained model inherits these inaccuracies, resulting in suboptimal performance.
This limitation is especially critical in high-stakes domains like healthcare, legal systems, and finance, where model errors can have severe implications. As a result, the ability to use unsupervised or weakly-supervised learning methods becomes a strategic advantage, allowing organizations to extract insights without depending entirely on human-labeled data.
A Case Study: Crop Classification in Agriculture
An illustrative example of supervised vs. unsupervised learning can be found in the agricultural sector, specifically in crop classification using satellite imagery. In a supervised scenario, you would need labeled satellite images where each pixel is annotated with the type of crop it represents (e.g., corn, wheat, soy). Such datasets are rare and expensive to produce. Institutions like the USDA provide this kind of data, but with an estimated 10% error margin, it becomes challenging to use these labels for competitive predictive modeling.
To address this, researchers may adopt an unsupervised learning approach. In this case, clustering algorithms are applied to satellite images to group similar pixel patterns together without prior knowledge of the actual crop types. Later, domain experts manually inspect the resulting clusters and assign labels to them. This semi-automated labeling process helps reduce manual effort while still producing meaningful data representations.
Machine Learning and Key Performance Indicators (KPIs)
Incorporating machine learning into business operations requires a deliberate alignment between model outputs and Key Performance Indicators (KPIs)—quantifiable measures of organizational performance, such as revenue growth, customer retention, ROI, or operational efficiency. For machine learning systems to generate meaningful business value, they must be conceived, developed, and evaluated in direct relation to such strategic metrics.
The process begins with identifying the KPIs most relevant to the specific business challenge and assessing how machine learning can support or influence these metrics.
Example
For instance, a model forecasting agricultural yield using satellite and environmental data can inform resource allocation decisions in agribusiness. These insights can affect market pricing, supply chain logistics, and financial forecasting, linking the model’s outputs to KPIs like cost reduction, margin improvement, and operational scalability.
It is critical, however, to recognize the supportive rather than autonomous role machine learning often plays in decision-making. Model outputs—such as yield predictions—typically serve to augment human judgment rather than replace it. In this context, machine learning becomes a component of a broader business intelligence ecosystem, enhancing situational awareness and strategic planning. Though models may not directly modify KPIs, they enable stakeholders to make better-informed decisions that do.
A fundamental component of value realization is the establishment of a continuous evaluation loop. Organizations must track not only model-centric metrics (e.g., accuracy, precision, mean absolute error) but also second-order effects—namely, the model’s actual impact on business KPIs. This requires comparative analysis of pre- and post-deployment trends and the isolation of AI-driven contributions. However, many enterprises fail to maintain this linkage post-deployment, resulting in model stagnation or underutilization.
This misalignment is often exacerbated by organizational and cultural divides. Technical teams may prioritize performance metrics without considering the business context, while decision-makers may lack the technical fluency needed to define objectives in actionable terms. The result is the deployment of technically robust but strategically disconnected models—systems that meet machine learning benchmarks yet fail to deliver real business impact.
Moreover, the context-specific nature of machine learning limits the transferability of successful implementations. A model yielding substantial KPI improvements in one enterprise may prove ineffective in another due to differences in data availability, operational practices, and digital maturity. This highlights the necessity of tailoring machine learning strategies to the unique structural and cultural characteristics of each organization.
Finally, long-term value depends on cultivating explainability and trust. Business users must not only consume model outputs but also understand their rationale. Building organizational data literacy, along with providing transparent visualizations, documentation, and intuitive interfaces, is essential for fostering trust and ensuring that machine learning becomes an integral and sustainable element of the decision-making framework.
Deep Learning
Deep learning represents a sophisticated and powerful subclass of machine learning algorithms, primarily designed to model complex patterns in large-scale data through the use of multiple layers of nonlinear processing units. These layers are organized in a hierarchical or “deep” architecture, hence the name. Each layer in this architecture is responsible for learning a representation of the input data, transforming it gradually from raw features into increasingly abstract and informative forms.
The goal is to extract relevant structures from the data that support prediction, classification, or decision-making tasks.
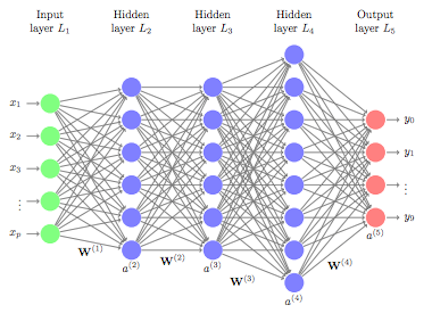
One of the most prominent examples of deep learning architectures is the artificial neural network, particularly deep neural networks (DNNs), which consist of many layers—sometimes hundreds—of interconnected neurons.
What sets deep learning apart from traditional machine learning is its ability to automatically learn feature hierarchies from raw data without the need for manual feature engineering.
- In classical machine learning, features are often hand-crafted based on domain knowledge, requiring significant expertise and time.
- In deep learning, the model learns to extract relevant features directly from the data during the training process, allowing it to adapt to complex patterns and relationships.
The depth of a deep learning model—measured by the number of layers—correlates with the complexity of the functions it can approximate. Simple tasks such as linear classification or binary decision boundaries might only require shallow networks or even simpler models like logistic regression. However, complex tasks such as image recognition, natural language understanding, or autonomous driving require deep networks capable of learning intricate, high-dimensional relationships in the data.
In practice, a deep neural network consists of an input layer that receives the raw data, multiple hidden layers where nonlinear transformations are applied, and an output layer that produces the final prediction. During the training phase, the model adjusts the weights of the connections between neurons using an algorithm such as backpropagation, often combined with an optimization method like stochastic gradient descent (SGD). The model is shown many labeled examples (in supervised learning), and it learns to minimize the difference between its predicted outputs and the actual labels by iteratively updating the internal parameters.
Ultimately, the design of a deep learning architecture—how many layers it includes, the type of activation functions used, the structure of the neurons, and the methods of regularization and optimization—must be carefully considered to balance model performance with computational cost and generalization capability.
Natural Language Processing (NLP)
Definition
Natural Language Processing (NLP) is one of the most significant application domains of deep learning. It focuses on enabling machines to understand, interpret, generate, and interact using human language in a meaningful way.
NLP spans a wide range of tasks such as machine translation, sentiment analysis, question answering, summarization, and dialogue systems. Over the last decade, the field has undergone a radical transformation, moving from rule-based systems to data-driven models, especially with the advent of deep learning and, more recently, large language models (LLMs).
From Rule-Based Engines to Learning-Based Systems
Historically, NLP relied heavily on rule-based systems, which were often classified into syntactic and semantic engines.
- Syntactic engines focused on the grammatical structure of sentences, using predefined rules to parse and analyze text. These systems could identify sentence boundaries, parts of speech, and grammatical relationships but lacked a deeper understanding of meaning or context.
- Semantic engines, on the other hand, aimed to infer the roles of words in a sentence, such as subject, verb, object, and complement. This deeper analysis allowed them to perform tasks like sentiment detection, where they could identify whether a sentence expressed positive or negative sentiment.
For instance, in the phrase "A is nicer than B," a semantic engine would recognize that the sentiment is positive toward A and relatively negative toward B.
However, these semantic engines were typically language-specific and required significant manual engineering.
The introduction of deep learning radically shifted the paradigm. Rather than relying on handcrafted rules, modern NLP systems learn patterns and representations directly from data. Deep neural networks, especially those based on architectures such as recurrent neural network, convolutional neural network, and transformers, have demonstrated exceptional capabilities in modeling language.
Transformers, introduced with the “Attention is All You Need” paper in 2017, became the foundation for today’s LLMs such as GPT, BERT, and their successors. These models are trained on massive text corpora and can generalize across tasks with minimal fine-tuning. They do not require explicit definitions of syntax or semantics; instead, they infer such structures implicitly from data. This advancement rendered traditional semantic engines largely obsolete from a technological standpoint.
Many companies that had previously built their value propositions on proprietary semantic technologies were forced to adapt: some integrated LLMs into their existing products, presenting them to customers as seamless upgrades. The advantage of having a market presence and established software integration allowed them to survive despite the obsolescence of their core technologies. Nevertheless, the intrinsic value of patents and rule-based engines diminished substantially, highlighting how technological relevance can quickly erode if companies fail to evolve.
Applications of NLP Technologies
At a foundational level, NLMs surpass traditional rule-based or statistical NLP systems by leveraging deep learning and contextual embeddings. This enables them to understand syntax, semantics, and even pragmatic aspects of language in a more sophisticated manner. Common applications include question answering systems, intelligent virtual assistants, document classification, content summarization, sentiment analysis, named entity recognition, and information retrieval. For example, web interfaces integrated with generative AI can provide summarized responses to user queries, a functionality that goes beyond traditional search engines like Google by offering synthesized answers from multiple sources.
These models also power more complex systems such as document tagging engines, automated customer service agents, and social media monitoring tools capable of real-time sentiment evaluation and brand reputation analysis. Within enterprise environments, NLMs support internal knowledge management, streamline customer communications, and enable automation of report generation, all of which contribute to operational efficiency.
Challenges in NLP
Despite the progress, not all challenges in NLP have been resolved. Speech recognition, for instance, continues to pose difficulties, especially in uncontrolled environments. While current systems can perform well in quiet, speaker-specific settings—like voice assistants responding to clear commands—they often struggle in real-world scenarios such as call centers.
As a result, speech-to-text technology still has limitations that affect usability in many practical applications. These shortcomings have led users to be cautious when relying on voice-based interactions with machines, especially in professional or noisy environments.
Even as LLMs offer groundbreaking capabilities, they are not without drawbacks.
- The hallucination phenomenon, where models generate plausible but incorrect or nonsensical outputs, remains a significant concern. This is particularly problematic in high-stakes applications where accuracy is paramount.
- Lack of verifiability and explainability in LLMs can lead to challenges in understanding how decisions are made, raising ethical and accountability issues. To mitigate these risks, organizations must implement robust validation and oversight mechanisms when deploying LLMs in mission-critical applications, and domain-specific models or agentic architectures are being developed to encapsulate general-purpose language models within a decision framework that can verify and refine the model’s outputs.
- The epistemological integrity of data-driven models is also a concern, as the act of storytelling can introduce bias even without fabrication. Data scientists may present only a subset of results to support a compelling narrative, inadvertently misleading their audience. This selective presentation distorts the interpretation of the data and can shape flawed business strategies, even when the underlying analysis was technically correct.
- The data governance aspect of LLMs is another critical issue. Organizations must ensure that the data used to train these models is ethically sourced, representative, and compliant with privacy regulations. The risk of bias in training data can lead to biased outputs, which can have serious implications in sensitive applications such as hiring, lending, and law enforcement.
- The computational cost of training and deploying LLMs is also a concern. These models require significant computational resources, which can be a barrier to entry for smaller organizations or those with limited budgets. The environmental impact of large-scale model training has also come under scrutiny, prompting discussions about the sustainability of AI practices.
The integration of AI-driven systems, particularly those based on Large Language Models (LLMs), introduces an intriguing paradox around the concept of trust. Human users may paradoxically place greater trust in systems that make random and clearly unintentional errors, as opposed to data-driven reports or dashboards that can be seen as curated or manipulated. However, it’s important to recognize that both humans and machines are prone to errors:
- Human analysts may misinterpret data, overlook anomalies, or introduce subjective biases. However, these human imperfections are often accepted as part of the analytical process.
- Machine learning models, especially LLMs, can produce errors that are difficult to diagnose or interpret, particularly in opaque architectures.
Despite this, such errors do not stem from malicious intent or cognitive bias, which might make them more acceptable in low-stakes or exploratory scenarios. As such, there is a growing argument that AI systems—despite their current limitations—can serve as supportive tools in exploratory data analysis and decision support, provided their limitations are clearly understood.
Chatbots
Before the advent of Large Language Models (LLMs), chatbots represented a transformative milestone in NLP, gaining wide adoption from around 2015. Defined as digital assistants capable of “working for us,” they were particularly useful for automating repetitive or simple technological tasks that users would otherwise perform manually.
The practical value of chatbots lay in their function as a task automation interface. They allowed users to request operations, such as:
- Mathematical calculations
- Setting reminders
- Fetching news
- Retrieving documents
The chatbot would either execute the task directly or interact with other services to return the result, enabling users to complete actions without opening separate applications.
A fundamentally important conceptual change brought by chatbots was the inversion of the traditional interaction paradigm, especially prevalent in the mobile app ecosystem. Historically, users engaged with services by downloading specific brand-tied apps and navigating their individual interfaces. Chatbots, particularly when embedded in messaging platforms, began to alter this model.
The core concept was to remove the need for users to explicitly open or manage multiple applications. Instead, users could simply “talk” to a central chatbot gateway, which would access various services via APIs. A company offering a service (like health monitoring) could integrate its backend, allowing users to access features through a single, unified conversational interface, making the original application and its brand less visible, almost “invisible.”
This model had significant implications for the software development landscape. Smaller developers who previously relied on standalone apps for visibility and revenue faced challenges in maintaining relevance. Their services, even if they still existed, would need integration into the chatbot’s backend, diminishing direct user engagement through dedicated app interfaces. For instance, developers of niche apps might see their presence reduced.
The rise of chatbot-centric interfaces also introduced broader societal and economic concerns. Centralizing the interface layer through chatbots tends to consolidate control among platform providers (typically large tech companies like Google, Amazon, or Meta). These entities gain the power to mediate:
- Which services are accessible
- How services are monetized
- The user experience delivered This makes traditional routes of branding, user acquisition, and market differentiation harder for smaller developers and service providers.
Furthermore, the invisibility of underlying applications raises ethical and policy questions. If users interact only with a chatbot and are unaware of the specific service provider, they might also lose awareness of critical details such as:
- Privacy policies
- Data-sharing agreements
- System reliability This raises complex questions about responsibility for the services accessed and the transparency of that access.
Explainable AI
The adoption of machine learning within organizations—particularly those lacking technical expertise in artificial intelligence—faces a significant challenge: fostering trust and understanding among stakeholders without a background in data science. For machine learning to be effectively integrated into decision-making processes, it must be made accessible and interpretable to non-technical users. This principle underpins the concept of Explainable AI (XAI).
A critical prerequisite for this integration is a phase of data discovery and exploration, centered on simplicity and transparency. The initial objective is not to implement complex algorithms, but to cultivate an intuitive grasp of the data through qualitative analytics. These methods rely on easily interpretable visual and statistical tools, grounded in basic mathematical reasoning—such as trend identification, simple comparisons, and pattern recognition (e.g., concurrent peaks or time lags between variables). Findings should be communicable via plots or summaries understandable even in non-technical contexts, such as public reports or newspapers.
Upon establishing a foundational understanding of the dataset, the next step involves introducing correlation analysis. Correlations quantify the strength and direction of relationships between variables using a concept familiar even to those without formal training. These models highlight both the most influential variables and whether their effects are positive or negative, thus reinforcing interpretability.
To deepen comprehension, box-based conceptual models can be employed. These visual frameworks illustrate causality, interdependence, and interactions among variables, serving as an intermediary between statistical outputs and the more abstract predictions of machine learning systems. By enhancing the clarity of the analytical process, they facilitate interdisciplinary communication.
Once stakeholders understand the data and its internal dynamics, the transition to machine learning becomes more seamless. At this stage, a random forest model may be introduced. As an ensemble of decision trees, it captures non-linear relationships that traditional correlation models cannot detect. Its purpose is not merely to improve predictive accuracy, but also to reveal the limits of linear reasoning and demonstrate the additional patterns that machine learning can uncover. By comparing its performance to simpler baseline models (e.g., via prediction error or classification accuracy), stakeholders can recognize the added value of machine learning, while still retaining a conceptual anchor in their prior understanding.
Managerial Skepticism Toward AI and Big Data Integration
Despite the rapid evolution of artificial intelligence (AI) and big data technologies, many managers remain skeptical about their practical value and long-term implications. This hesitation often stems from a fundamental, oversimplified dilemma: should human workers be replaced with AI systems, or should AI be used to enhance human capabilities? This reflects a limited understanding of the technological and organizational complexities involved in AI integration.
The concern that AI will entirely replace human labor reflects a narrow view of technological disruption. Historically, technological innovations have consistently transformed the nature of work rather than eliminated it altogether. Just as information technology in the late 20th century automated administrative tasks but created new roles in IT support, cybersecurity, and data analysis, AI and machine learning are expected to change the structure of work. Human workers will likely need to transition into roles requiring complex decision-making, creativity, and interdisciplinary thinking—tasks currently beyond AI’s reach. Instead of framing AI adoption as replacement, organizations should approach it as an opportunity to augment human capabilities. A gradual, iterative implementation strategy is more likely to succeed than a rapid, revolutionary shift. This involves introducing AI to support new activities or improve existing processes without triggering resistance. If AI tools are first applied to novel tasks that add complexity or offer new opportunities, employees are more likely to accept future automation of redundant or low-value activities. This step-by-step approach builds internal competence and trust while minimizing disruption.
From a managerial perspective, a key challenge is the perception that AI and machine learning are excessively complex and opaque. This hinders their inclusion in strategic decision-making, especially for managers lacking a data science or engineering background. While technologies like LLMs have democratized access, the underlying systems remain technically sophisticated and often misunderstood, making it difficult for managers to evaluate practical benefits and risks. Bounded rationality applies here: managers cannot be experts in everything, and when a technology is perceived as arcane, they may defer decisions, rely on external consultants, or simply disengage. This highlights the importance of user-friendly interfaces and compelling demonstrations of AI’s practical utility to overcome these psychological and cognitive barriers.
Another significant factor contributing to skepticism is the reliance on pilot projects. Organizations often initiate short-term AI pilots with limited scope and budget, sometimes using leftover funds. While pilots are useful for exploration, they often fall short of demonstrating AI’s full value due to insufficient time, narrow objectives, or incomplete data readiness. When these projects yield mixed results, decision-makers may wrongly conclude the technology isn’t viable, missing opportunities to iterate and improve.
Moreover, organizations frequently lack the necessary data infrastructure to support effective AI applications. High-quality machine learning models depend on large, well-integrated datasets with synchronized timestamps and consistent representations. However, many enterprises operate with fragmented data architectures composed of siloed operational databases developed over decades. Even conceptually integrated systems like data warehouses often fail to provide the real-time, granular data needed for accurate AI-driven insights.
For example, predictive maintenance requires time-series data with unified temporal resolution across all features; if subsystems update asynchronously or store data incompatibly, training data quality suffers, leading to poor model performance, as AI systems follow the "garbage in, garbage out" principle.
Additionally, key performance indicators (KPIs) on managerial dashboards are typically derived from preselected critical success factors (CSFs), which may not align with the data needed to train AI models. Organizations might monitor metrics valuable for reporting but insufficient for generating accurate predictive models, complicating efforts to derive value from AI. Another technical challenge is the scale and volume of data required. Effective AI, especially in domain-specific applications, needs vast amounts of data that are also consistently updated, accurate, and semantically aligned. Many organizations collect and store data in isolated systems that aren’t continuously synchronized or operationally integrated, making timely insights or real-time AI deployment difficult. These data integration challenges are not merely technical but also organizational, often tracing back to long-past strategic decisions on system design, procurement, and data governance. Retrofitting modern AI into such environments is costly, time-consuming, and requires strong executive support, further contributing to managerial hesitation in fully committing to AI-driven transformation.
How Big is Big Data?
Definition
Big data is a collection of data from traditional and digital sources inside and outside your company that represents a source for ongoing discovery and analysis.
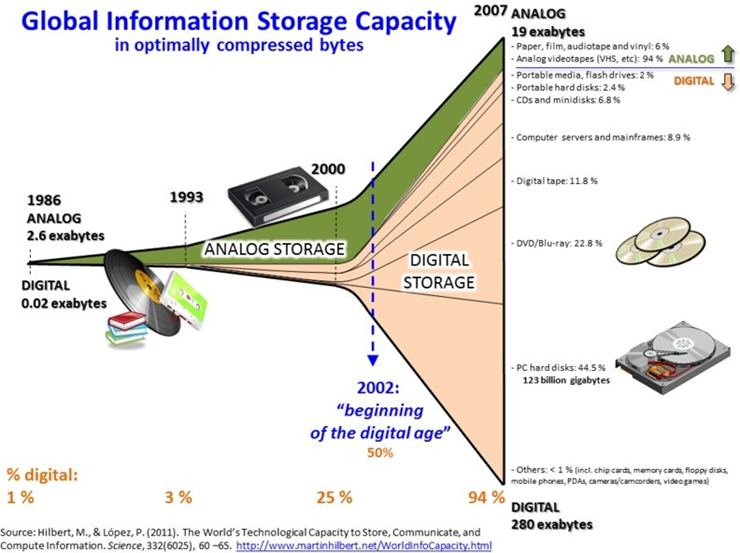
The expression “Big Data” refers not merely to the absolute volume of data but to the broader phenomenon of exponential data growth that has accelerated over the past two decades. One of the pivotal moments in this transformation was the transition from analog to digital data storage. As organizations and individuals began to store more information in digital formats, the rate of data accumulation began to climb dramatically.
A key factor in this explosion was the advent and widespread adoption of the Web, particularly with the emergence of Web 2.0 technologies, which enabled a participatory, user-centered approach where data generation became a two-way process. Users started producing content—reviews, comments, videos, photos—which further expanded the pool of available data exponentially. This democratization of content creation made vast quantities of data publicly available and interconnected.
At the organizational level, the evolution of Information Systems reflects a progressive enrichment in the types of data captured. Initially, IS focused on managing operational data. Over time, they evolved to support executive functions, customer relationship management (CRM), and integrated services across channels. By the early 2000s, companies had begun collecting structured data across departments. However, training machine learning models requires not just data but historical, integrated, and cross-functional datasets. Only in the past decade have many companies matured enough to meet these prerequisites, thus creating the proper conditions for Big Data and analytics to become truly impactful.
Big Data and Web-Based Applications
The widespread interest in Big Data around 2010–2015 stems from a confluence of historical and technological developments. On one side, companies had accumulated enough digital, integrated, and historical data to make machine learning viable. On the other, the explosion of multimedia content, social networks, and user-generated data created a new universe of data types, often unstructured, that traditional systems could not handle.
The Web has not only contributed to data generation but also to the deployment of intelligent systems that leverage such data.
One emblematic example is recommendation systems, widely implemented in e-commerce and streaming platforms. These systems suggest products or content based on user interactions.
For example, clicking on “organic pesto” may lead to recommendations for “whole-wheat organic pasta.” These applications rely heavily on machine learning models trained on user data and are made possible by the web’s ability to track user behavior across sessions and platforms.
Importantly, recommendation systems are typically non-critical applications: they do not involve monetary transactions directly and do not replace human workers. Instead, they augment the customer journey and allow marketing teams to focus on higher-level strategic decisions. This dynamic introduces a new paradigm: automation and analytics are not necessarily about job replacement, but about adding complexity and value to existing roles.
What Size is Big Data?
It is important to understand that Big Data is not defined solely by volume. A few terabytes of data might not sound like much in absolute terms—after all, consumer-grade storage devices can now hold that amount for a few hundred euros. However, when you need to analyze that data using machine learning, the computational complexity increases dramatically. The bottleneck is not in storing the data, but in processing it effectively.
There is no universally accepted threshold for defining “Big Data” in terms of size. Some experts argue that Big Data starts at the scale of petabytes (
Even datasets in the range of a few gigabytes or terabytes can become “Big Data” if they present challenges for current infrastructure—especially when real-time analysis or complex model training is required. Trying to run a machine learning pipeline over a terabyte-scale dataset using consumer-grade tools like Pandas or Scikit-learn often results in serious scalability issues.
This is why companies like Google, Amazon, and Microsoft, which have developed their own scalable algorithms and infrastructures, hold a competitive advantage. They can handle large-scale data processing and can even commercialize these capabilities via cloud platforms (e.g., Google Cloud, AWS, Azure).
Types and Scale of Big Data
The concept of “big data” refers not only to large volumes of information but also to the variety, velocity, and complexity of the data being generated and analyzed in modern digital ecosystems. There are multiple ways to classify big data depending on its format and source. Some of the most common categories include textual data, multimedia data (images, audio, video), sensor data, Internet of Things (IoT) data, and customer data from web logs or traditional information systems. Each type of data presents its own challenges in terms of storage, processing, and analysis, and understanding these characteristics is fundamental when designing scalable data solutions.
It is essential to recognize two forms of scalability that influence big data projects:
- Technical Scalability refers to whether it is technically feasible to store, process, and analyze the data using available tools and infrastructures. This involves hardware, software, computational power, and algorithmic efficiency.
- Economic Scalability assesses whether it is financially viable to undertake the analysis. Even when a technical solution exists, the costs related to computational infrastructure and skilled personnel may outweigh the benefits, making the project unsustainable for the organization.
Text Data
Text data is among the most prevalent and foundational forms of big data. Platforms such as Twitter offer a good case study for evaluating scale. On average, Twitter users generate:
- 350,000 tweets per minute
- 500 million tweets per day
- 200 billion tweets per year
This results in approximately 25 terabytes of text per year, even when ignoring attached media (images or videos). Analyzing such data in the form of time series or semantic streams involves significant computational resources.
However, if the scope is narrowed to a localized brand or topic, the data volume can become more manageable. For instance, analyzing all Twitter mentions of a local brand in a city like Milan or Madrid might result in just 3,000 tweets per day, amounting to 60 megabytes per year—which is small in terms of storage, but potentially still demanding in terms of analysis if complex natural language processing is required.
For global brands such as Nutella or those in cities like London, the volume rises dramatically to several gigabytes per year, necessitating scalable semantic analysis systems. These engines, however, can be quite slow. Older semantic processors could analyze only 1 MB of text per core per day, meaning that processing tens of gigabytes might require thousands of cores or many days of computation.
Multimedia Data
Multimedia data presents even greater challenges in terms of both size and complexity. For example:
- Satellite images from missions like the European satellite Sentinel-2 generate over 150 petabytes per year, even though their resolution is not extremely high.
- High-definition videos on platforms like YouTube have now surpassed the exabyte scale (1 exabyte = 1,000 petabytes).
- A single hour of recorded conversation can occupy approximately 30 MB, meaning that call centers managing thousands of daily calls can easily accumulate hundreds of terabytes of audio recordings annually.
Processing these datasets in real-time or even retrospectively is extremely expensive and time-consuming. As a result, organizations often shift to on-demand analytics, where only requested segments or regions of interest are processed, rather than the entire dataset. This reduces the need for immediate processing and storage but introduces latency and complexity in querying and data availability.
Sensor and IoT Data
Sensor data and Internet of Things (IoT) applications generate continuous streams of information. Examples include:
- Video surveillance systems that can generate 1 petabyte of video footage every 5 days.
- Automotive sensors that can produce 1 terabyte of telemetry data every 2 days per vehicle.
Due to such high velocity and volume, this data is often discarded after short retention periods (e.g., 24 hours) unless legally or strategically mandated otherwise. The storage costs, coupled with privacy regulations, force businesses to implement selective retention policies.
Moreover, some Enterprise Resource Planning (ERP) systems like SAP HANA encourage in-memory analytics to increase model training speed. However, RAM is significantly more expensive than disk storage, and storing even half a terabyte in-memory can be cost-prohibitive. Thus, economic barriers often appear well before technical ones.
Web and Traditional Customer Data
Web customer data includes user activity logs, such as web clicks, session durations, and behavioral metrics collected from ERP or CRM systems. These logs form the basis of clickstream analysis, a technique in marketing analytics used to understand customer behavior before a purchase. Clickstream data offers unprecedented insight into pre-sale behavior, which is traditionally lost in physical retail environments.
Though the volume of web log data might appear moderate—often a few terabytes per year—it is still considered big data due to its granularity and structure. For example, analyzing user paths across a website requires high-frequency timestamped data and user identifiers, which makes processing more complex.
Example
To illustrate, a supermarket chain storing 10 years of detailed transactional data at the item, time, and location level might accumulate only 100 gigabytes of raw data. However, the infrastructure required to effectively query and model such data often resembles that of a much larger dataset due to its relational complexity and update frequency.
Technical Limits, Workarounds and Automated Solutions
In practice, most companies do not retain long-term historical data due to technological and economic limitations. Often, databases are overwritten on daily, weekly, or monthly cycles, eliminating any chance of trend or time-series analysis unless archiving procedures are in place.
Even organizations with large datasets—such as banks—may possess less than 1 petabyte of total data, including structured information, customer interactions, and media files. Despite the data being technically “manageable” in size, scalability issues frequently arise due to the complexity of applying machine learning models, especially when the infrastructure or internal skills are insufficient to deploy these models into production environments.
Due to these challenges, many businesses turn to sampling techniques and automated machine learning platforms. Instead of analyzing ten years of customer history, analysts may work with one-month samples, or examine subsets of customer segments (e.g., 100,000 users instead of 10 million).
Automated tools such as KNIME, DataRobot, or other AutoML platforms allow users to upload pre-processed datasets and perform model training, hyperparameter optimization, and performance evaluation with minimal intervention. These tools can be highly effective, but their reliability is heavily dependent on the quality and completeness of the input data. Even minor inconsistencies or missing features can render the results meaningless.
In enterprise contexts, over-reliance on AutoML without proper data engineering and validation may compromise the trustworthiness and reliability of the models. As a result, while these tools lower the technical barrier to entry, they should be used with caution and expert oversight.
The Evolution of Big Data Projects
In the realm of Big Data, the initial challenge is often not the volume or velocity of the data, but the fundamental lack of understanding regarding what the data represents. When presented with a new dataset, it is critical to first recognize that, without any prior analysis, the underlying customer behavior patterns, trends, or correlations remain completely unknown.
Example
For instance, web log data may contain vast information about user interactions, yet without proper scrutiny, insights such as seasonal behaviors, customer segmentation patterns, or navigation paths through a website remain concealed. This initial state of ignorance underscores the necessity of beginning any Big Data project with a descriptive analytical phase.
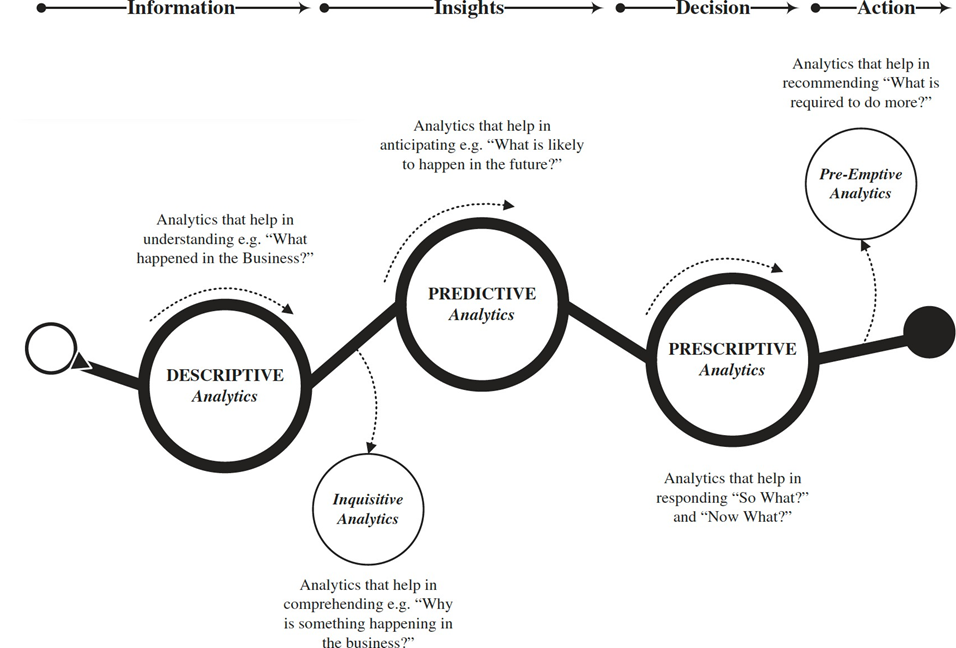
Descriptive Analytics
The first essential step in any Big Data pipeline is descriptive analytics.
Definition
This analytical phase is concerned with summarizing and interpreting historical data to uncover patterns and basic statistics that describe what has happened within a system.
For example, in an e-commerce context, descriptive analytics may involve calculating the average number of page views or clicks that users perform before abandoning a purchase. Similarly, it can identify peak usage times, detect anomalies in customer behavior, or determine the distribution of visits across different product categories.
Descriptive analytics serves as the foundation for all subsequent stages in the data analysis lifecycle. It equips data scientists, analysts, and decision-makers with a comprehensive view of the data, allowing them to assess its quality, completeness, and potential relevance. Importantly, it also acts as a filtering stage, helping determine whether the dataset possesses meaningful information worth further exploration.
Predictive Analytics
Once the descriptive phase has yielded sufficient insights and the data has been validated for quality and relevance, the next logical progression is toward predictive analytics.
Definition
This stage focuses on using historical data to make informed guesses about future events.
Predictive analytics encompasses a wide array of methodologies, including classification, clustering, regression models, and time series forecasting. These techniques enable businesses to anticipate customer churn, forecast product demand, or identify users most likely to convert.
Machine learning plays a pivotal role in predictive analytics, especially when dealing with complex, nonlinear relationships that traditional statistical models struggle to capture.
- Linear models may provide quick and interpretable insights, but they often fall short in capturing the intricate, high-dimensional nature of real-world business data.
- Machine learning models, on the other hand, can handle these complexities and often yield more accurate and robust predictions, albeit at the cost of interpretability.
From a managerial perspective, prediction is a cornerstone of strategic planning. Managers frequently rely on trend analysis and forecasts to guide decision-making and allocate resources efficiently. Hence, predictive models that are empirically validated and tailored to business contexts have high practical value. A well-built predictive system offers decision support without replacing human judgment, enhancing the precision and confidence of planning processes.
Prescriptive Analytics
The natural extension of predictive analytics is prescriptive analytics. In this phase, the focus shifts from forecasting outcomes to recommending or automating actions that can optimize specific objectives.
Definition
Prescriptive systems may determine which product to recommend to a customer, which marketing strategy to deploy in real time, or even what operational adjustments to make in response to shifting demand patterns.
A prescriptive analytics system does not merely inform decisions—it makes them, often autonomously.
For instance, if a predictive model infers that a user browsing a pasta recipe page is highly likely to purchase ingredients, a prescriptive engine might immediately adjust the product recommendation engine to prioritize pasta-related items.
In digital ecosystems, where decisions must be made in milliseconds, human intervention is impractical. Consequently, prescriptive models are often embedded into live production systems where latency and scalability are critical.
However, real-world adoption of prescriptive analytics is not without constraints. In some domains, decision-making requires human oversight due to legal, ethical, or logistical considerations. Moreover, the downstream infrastructure must be capable of processing and acting upon the model’s outputs.
For example, satellite-based monitoring systems may produce highly accurate insights on infrastructure movement or geological instability, but operational constraints—such as the availability of maintenance teams or budget limitations—may prevent immediate action.
The Challenges of Big Data
When dealing with big data and advanced analytics, one must not underestimate the inherent challenges that accompany their practical adoption. These challenges are not merely technical; they also involve cultural, managerial, and educational dimensions. As businesses strive to become more data-driven, they encounter numerous obstacles that slow down or even impede the path toward innovation.
The first and perhaps most persistent challenge relates to the general skepticism surrounding new technologies. This skepticism is particularly acute in countries like Italy, where technological change is often met with caution and reluctance. Italian firms, for instance, tend to be more knowledge-oriented than technology-oriented, which translates into a slower adoption curve for cutting-edge digital solutions. Despite the promise of tangible advantages, organizations are slow to adopt new systems due to a lack of internal expertise, uncertainty about returns, and hesitance to commit resources. Consulting firms may step in to help, but even then, their role is often complicated by superficial rebranding—where existing staff are relabeled as “data scientists” without acquiring new skills.
Companies often begin with small pilot projects designed to test the waters. These pilots, however, are typically underfunded—budgets may range from €10,000 to €50,000—and rarely lead to immediate success. It’s common for the first pilot to fail due to inexperience or strategic misalignment. Yet, such failures are crucial learning experiences. They allow both consultants and companies to identify what went wrong and recalibrate their approach. Even if the second attempt comes a year later, it is usually better informed and more likely to succeed. The entire process—from the initial contact to the successful deployment—can take years, which is why true innovation often requires long-term vision and persistence.
Moving From Excel to MySQL
Another key challenge lies in acquiring the right technical and analytical skills. The fast pace at which data technologies evolve means there is often a lag in available expertise. Companies face difficulties in hiring personnel who not only understand the technical side—such as data processing, querying, and modeling—but also the business domain where analytics must be applied. A successful analytics initiative requires both the knowledge of how to process data and the ability to interpret it within a specific business context.
Moreover, getting business stakeholders involved is itself a significant hurdle. In many organizations, managers have limited exposure to modern analytical methods or machine learning. When the data sets are small enough to fit into Excel, many business professionals with backgrounds in economics or management feel confident analyzing them independently. They create dashboards and reports that influence major business decisions, such as pricing strategies in revenue management. However, this reliance on Excel becomes problematic as data volumes grow. Excel’s capacity—approximately one million rows and 16,000 columns—falls short of the needs of even traditional customer databases.
Managers often respond by selecting small subsets of larger datasets to analyze in Excel, a practice that can lead to poor decision-making due to incomplete or biased information. As datasets grow in size and complexity, Excel becomes an inadequate tool, yet it remains the default for many non-technical users because of its familiarity and ease of use.
To address this mismatch, organizations typically evolve their tools and practices gradually. Some might transition to Microsoft Access or MySQL, allowing for more sophisticated querying through SQL. In this stage, collaboration between business users and technically skilled staff becomes essential. Analysts or engineers write SQL queries to extract relevant information, while business users interpret and visualize the results. Ideally, professionals should be trained in both technical and business domains.
The goal is to cultivate hybrid profiles capable of extracting, analyzing, and interpreting data within a meaningful business context.
MySQL Adoption
Adopting MySQL or similar open-source databases requires evaluating both technical feasibility and economic scalability, especially in environments with diverse data sizes and workloads. The distinction between OLTP and OLAP is central here.
- OLTP (Online Transaction Processing) systems, such as those in banking or ERP platforms, prioritize data integrity and concurrency under frequent, small transactions. These systems are optimized for consistency and rollback support, often incurring performance overhead that makes them less suitable for complex analytics.
- OLAP (Online Analytical Processing) systems, focus on scanning large datasets for aggregations or model training, where transactional guarantees are less critical. Performance in OLAP workloads hinges on data volume and I/O throughput rather than locking or atomicity.
To manage these divergent needs, organizations traditionally separated transactional and analytical systems through data warehouses, relying on ETL processes to offload OLTP data into OLAP-optimized structures. While efficient for batch analysis, this model struggles with real-time analytics, which demand immediate access to fine-grained, live data—bypassing the latency of periodic ETL updates and challenging the summarization strategy of traditional warehouses.
Attempts to unify OLTP and OLAP via dual-purpose databases, have proven costly and complex. Enterprise solutions like Oracle can technically support such setups with features like in-memory engines and advanced indexing, but at the cost of high licensing and infrastructure expenses.
This cost barrier leads many to adopt MySQL, a robust, open-source RDBMS that supports high-performance applications without licensing fees. However, MySQL’s performance depends heavily on in-memory caching, which is constrained by RAM availability. Since memory access is orders of magnitude faster than disk, caching is essential—but impractical for multi-terabyte datasets, making vertical scaling costly and limited.
Horizontal scaling with MySQL, such as clustering or sharding, introduces additional complexity. Efficient distribution of data and queries requires deep technical knowledge, and performance gains often plateau without precise optimization.
In analytical scenarios, these constraints become more pronounced. Unlike OLTP workloads, analytics require wide-ranging access to historical or raw data, rendering caching less effective and intensifying I/O bottlenecks. While proprietary solutions address these challenges with sophisticated scalability features, their cost remains prohibitive for many. As a result, organizations must balance between high-cost enterprise tools and technically demanding open-source alternatives like MySQL.
Hadoop
Definition
Hadoop is an open-source framework developed by the Apache Software Foundation that was initially heralded as a revolutionary solution for storing and processing vast amounts of data in a distributed manner.
Its design allows it to scale from a single server to thousands of machines, each offering local computation and storage. Despite the initial enthusiasm surrounding Hadoop, its real-world adoption has been more complex and, at times, disappointing, especially when measured against the high expectations set during its early rise in popularity.
The framework itself can be installed and tested quite easily in a single-node configuration, making it approachable for students and researchers. However, moving from a local deployment to a fully functional multi-node cluster introduces a high level of technical complexity. The tasks of configuring the cluster, managing node communications, tuning the performance, and ensuring fault tolerance require in-depth knowledge of distributed systems, Linux administration, and network configurations.
This technical barrier to entry highlights one of the critical shortcomings in Hadoop’s broader market adoption: the steep learning curve associated with deploying and maintaining a production-grade cluster. Consequently, many organizations found themselves unable to harness Hadoop’s full potential due to a lack of specialized personnel. This skill gap opened a window of opportunity for commercial vendors like Cloudera, Hortonworks, and MapR, who began offering enterprise-ready distributions of Hadoop.
Commercial distributions of Hadoop aim to abstract away the complexity inherent in the original open-source release. These versions include automated tools, graphical interfaces, and pre-configured setups that drastically simplify the installation and management processes.
For instance, Cloudera has industrialized the operational aspects of Hadoop by providing services that automate the orchestration of nodes, start-up of services, and monitoring, turning what was once a cumbersome manual process into an enterprise-ready solution.
The core idea is to reduce the necessity for in-house expertise, allowing companies to deploy big data solutions without maintaining a dedicated team of Hadoop experts.
The next logical step in the evolution of Hadoop-based services was the move to the cloud. Companies like Cloudera partnered with cloud providers such as Google Cloud to offer fully managed Hadoop services. These cloud-based solutions go a step further than enterprise distributions by eliminating the need for customers to install, configure, or manage infrastructure altogether. Users simply procure the required computational capacity and start analyzing data using a pre-configured Hadoop stack, fully managed and maintained by the service provider.
This approach aligns with the broader philosophy of cloud computing, which emphasizes elasticity, scalability, and minimal operational overhead. Fully managed services allow companies to focus on deriving insights from their data, rather than becoming bogged down in the complexities of infrastructure management.
Scalability and Hardware Considerations
One of Hadoop’s core architectural strengths is its ability to achieve horizontal scalability using low-cost, commodity hardware. Unlike traditional data warehousing appliances, which are expensive, proprietary systems that combine hardware and software in a tightly integrated package, Hadoop was designed to operate effectively on inexpensive servers. This design choice makes it particularly appealing for organizations looking to reduce capital expenditures.
In practice, Hadoop can scale to handle hundreds of terabytes or even petabytes of data. While its theoretical upper limit is cited at around 120 petabytes, actual deployments often fall below that threshold due to the complexity and overhead associated with managing extremely large clusters.
The choice to use commodity hardware also means that the cost per node is relatively low.
For example, a mid-range server capable of handling a terabyte of data can be purchased for approximately 5,000 euros.
Scaling up by adding more servers remains economically feasible, especially when compared to the cost of high-end appliances from vendors like Teradata, which may reach millions of euros and include recurring maintenance and licensing fees.
Over time, though, support for SQL was introduced because most professionals are familiar with it, and its simplicity makes it hard to abandon. However, the SQL implementation in Hadoop didn’t initially deliver satisfactory performance, especially when users began to apply complex queries involving multiple tables and joins. The architecture was not designed for fast, interactive queries, and performance became a bottleneck.
To address this, Apache Spark emerged. Spark introduced in-memory computing, which allowed for significant performance improvements. But this came at a cost: storing large datasets in memory increased resource requirements and infrastructure costs. When scaled up—for instance, multiplying performance by a factor of 10 to go from 50,000 operations to 500,000—the costs became comparable to traditional systems. In engineering, a change is only considered transformative if it brings an order-of-magnitude improvement; otherwise, it’s considered an incremental enhancement.
One key weakness of Hadoop is its poor random read performance. This makes it unsuitable for all types of applications. The truth is, different applications require different types of databases. Hadoop fits into this by offering a wide ecosystem with components optimized for specific needs.
Technological and Business Implications
From a technical standpoint, Hadoop is optimized for “write-once, read-many” access patterns, making it well-suited for analytical workloads, such as large-scale data processing and batch-oriented tasks. It is less effective for use cases that require frequent data updates or low-latency responses, such as online transaction processing (OLTP).
For businesses, adopting Hadoop requires a careful evaluation of long-term strategy and core competencies. Organizations must decide whether to build in-house capabilities to manage big data infrastructure or to rely on commercial or cloud-based offerings that simplify operations. The decision depends on various factors, including the nature of the data workloads, the level of control required, cost constraints, and the availability of skilled personnel.
Core Components of Hadoop
Technically speaking, HDFS (Hadoop Distributed File System) is one of the most successful parts of Hadoop. Hadoop can optimize queries, but it’s most effective when the data fits a particular paradigm: a single, large, flat table.
Example
For instance, if you’re working with machine learning models and have all your features and timestamps in one integrated table, you don’t need join operations. In this case, Hadoop performs well. However, if you have a complex schema with long, nested queries involving many joins, Hadoop becomes problematic.
This is why it’s important to understand your data schema and how your algorithm will interact with it. In traditional machine learning, you prepare your data, extract features, integrate into a single table, and then train your model. The process follows a typical analytics pipeline: descriptive, diagnostic, predictive, and finally prescriptive analysis.
In these scenarios, the best performance comes from denormalizing the schema—essentially creating a large flat table with repeated data. While this increases data redundancy, it’s acceptable in analytical applications where transactional consistency is not a concern. Denormalization improves query performance, and putting the data in memory multiplies performance even further, albeit at a cost.
The Challenge of Acquiring and Integrating Enterprise Data
While modern technologies such as Hadoop and cloud computing have reduced barriers to data adoption and improved scalability, one of the most persistent challenges for organizations remains the effective acquisition, standardization, and integration of data across complex, heterogeneous environments. Simply having advanced data infrastructure does not guarantee that usable or high-quality data will be readily available. Often, acquiring that data proves to be one of the most time-consuming and technically demanding aspects of any data-driven project.
A major obstacle to seamless data integration arises from the lack of standardization across the software systems in use within a single enterprise. Companies evolve over time through acquisitions, legacy investments, and experimentation with different technologies. As a result, the technical landscape of many organizations becomes fragmented. Multiple divisions may use different tools and platforms, and migrating from one system to another is often infeasible without extensive re-engineering. The general industry rule—“if it works, don’t touch it”—still prevails. In practice, once a system satisfies current operational needs, it tends to remain in place, even if it impedes integration or modernization efforts.
This layered accumulation of technologies leads to siloed architectures that resist interoperability. While executive-level presentations may depict elegant, modern, and fully integrated system diagrams, the reality encountered by data scientists on the ground often reveals a different picture—where data is scattered, systems are partially connected, and access is inconsistent. This disconnect becomes immediately apparent when analysts or data scientists begin requesting data across business units.
To optimize operations such as procurement and supply chain management, organizations need to consolidate this fragmented knowledge. One path forward involves the integration of engineering estimates with procurement systems using predictive analytics or machine learning models. These models can refine procurement forecasts by learning from historical over- and under-estimations. However, deploying such models requires access to unified data.
Even after resolving technical incompatibilities, aligning the business logic behind the data remains a critical challenge. Different engineering groups may follow different estimation methodologies, making it difficult to reconcile their outputs. The data scientist or system architect must negotiate consensus or apply statistical normalization strategies to unify diverse practices. All this must be done while maintaining accuracy and domain relevance, further complicating the task.
A theoretical solution might involve standardizing on a single system across the organization. While this would simplify data handling, in practice, it faces strong resistance. Engineers are often deeply familiar with their current tools and workflows. Transitioning to a new system would require significant retraining and a temporary drop in productivity—possibly for months. Therefore, the necessary “window” to implement such standardization rarely appears unless mandated by strategic leadership.
Moreover, in sectors where engineering throughput is directly tied to revenue—such as in project bidding or feasibility studies—slowing down operations to implement technical changes could have a direct negative impact on business performance. As a result, organizations may postpone these changes indefinitely, leading to long-term inefficiencies and data silos.
Example
In telecommunications, for instance, operational data such as network traffic and technical performance is often decoupled from customer and billing data. As a consequence, network engineers may optimize infrastructure without any knowledge of which specific customers are impacted by service quality issues. This separation prevents telecom operators from linking infrastructure investments directly to customer experience, revenue growth, or customer retention metrics—undermining the ability to establish meaningful KPIs for ROI analysis.
The inability to correlate technical events with business outcomes is a systemic failure of data integration. Overcoming it requires a shift toward unified data architectures where information from multiple domains—engineering, operations, customer management, and finance—can be integrated and analyzed holistically. However, implementing such architectures requires not only technical solutions (such as common data models, middleware, or data lakes) but also organizational alignment, process redesign, and change management.
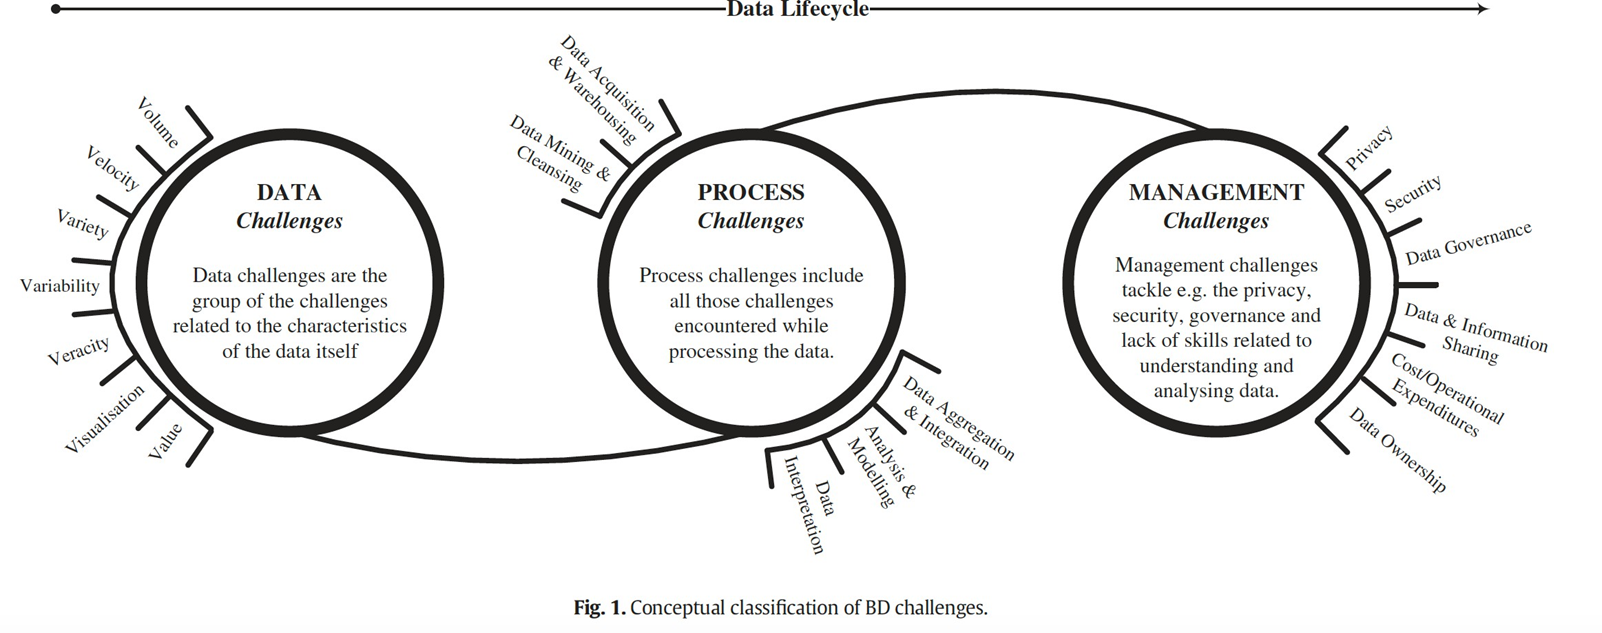
Data Lifecycle Management
Data Lifecycle Management (DLM) refers to the governance of data throughout its entire existence within an organization—from its initial creation, through its various stages of usage, until it is no longer needed and ultimately deleted. This concept is critical in modern data-driven enterprises, yet often underestimated in practice.
The lifecycle begins when data is generated, either through business operations, user interactions, or automated systems. Over time, this data may be updated, enriched, or processed to support different business needs. However, a common issue is the accumulation of data that is never revisited, cleaned, or deleted. This phenomenon resembles personal computer storage behavior: files accumulate until the storage limit forces a decision—either delete or upgrade. Organizations often adopt the latter approach, investing in more storage rather than confronting the root issue. While this may postpone immediate problems, it cultivates inefficiencies, redundancy, and operational risks over time.
One of the main challenges of DLM lies in the fact that deleting data rarely feels urgent. Businesses continue to operate smoothly whether obsolete records remain in the database or not. When clients churn or services end, their data often lingers in the system indefinitely. This poses legal, regulatory, and financial risks, especially under privacy laws like GDPR or HIPAA. Despite these risks, deletion is deprioritized because it doesn’t directly disrupt business continuity.
Effective data lifecycle management, therefore, requires proactive strategies. Organizations must implement models and procedures that clearly define when and how different categories of data should be archived or deleted. This process may not be fully automatable; it requires both technical modeling and human judgment.
Designing a Data Management Process
Implementing DLM involves organizational commitment and formalized workflows. Dedicated roles—often filled by professionals within organizational or compliance departments—are tasked with ensuring that data handling policies are both defined and enforced. These roles may oversee tasks such as ensuring developers implement deletion routines in their code, managing historical data through dedicated archiving mechanisms, and establishing storage policies such as time-based sliding windows.
Governance, Overhead, and Organizational Implications
DLM does not come for free. It introduces organizational overhead, including policy drafting, stakeholder meetings, documentation efforts, and compliance verification. As a company’s IT infrastructure and data volume grow, the complexity and cost of managing DLM increase proportionally. Despite appearing administrative and, to many engineers, uninspiring, this governance is essential for maintaining a sustainable digital environment.
Often, these responsibilities fall outside the IT department and are instead managed by a specialized “Organization” function within the company. Individuals in this role typically have educational backgrounds in organizational behavior, management science, or business administration. Their goal is to ensure functional alignment across departments, including enforcing consistent data management practices. While they may not possess deep technical expertise, they hold substantial authority and are instrumental in orchestrating cross-functional collaboration around data governance.
Workforce Challenges in Technical Roles
A recurring problem in many enterprises is the difficulty in hiring and retaining skilled technical personnel, particularly in specialized roles like data engineers. For example, insurance companies and banks may still develop parts of their IT infrastructure in-house. However, these roles are less attractive to highly skilled computer scientists and engineers, who are in short supply and often prefer positions in consulting firms or technology startups offering more innovative or varied work.
This mismatch between supply and demand results in high turnover, with engineers frequently leaving within their first year. Consulting firms, although demanding, offer broader exposure and typically more stimulating projects. They attract top talent despite offering only marginally better compensation because of the perceived prestige and learning opportunities.
The labor market has also seen a significant shift in how data roles are perceived. A few years ago, Harvard Business Review dubbed the data scientist “the sexiest job of the 21st century.” This glamorization led many to rebrand themselves as data scientists, sometimes without sufficient foundational skills. However, while interest in data science grew exponentially, the equally critical role of the data engineer—who builds the robust systems needed to manage massive datasets—remained neglected. As a result, many data-intensive problems persist due to a shortage of capable engineers to solve them.
Data science tends to appeal more because it sits at the intersection of technology and business.
- Data scientists are often tasked with understanding business problems and applying analytics to generate insights or predictions.
- Data engineers are responsible for the underlying infrastructure and performance, a role more technical and less visible.
This division has led to an imbalance in the labor market, with a surplus of data scientists and a scarcity of engineers who can support them.
Organizational Issues
The topic of organizational issues in the analytics domain touches upon the evolution of platforms, the structure of the market, and the relationship between innovation and adoption across vendors. According to Gartner, a well-established global research and advisory firm specializing in IT and business trends, the analytics market comprises a wide range of vendors—precisely 43 at the time of reference. These vendors are typically categorized into two main groups: mega vendors and smaller vendors.
- Mega vendors are large, established companies that offer comprehensive analytics solutions, often integrated with other enterprise software. Examples include IBM, Microsoft, Oracle, and SAP. These companies dominate the market due to their extensive resources, established customer bases, and broad product portfolios.
- Smaller vendors, on the other hand, are often more agile and innovative, focusing on specific niches or advanced functionalities. They may offer specialized tools for data visualization, machine learning, or real-time analytics, catering to specific business needs.
At the time the original data was collected (approximately five years ago), only a minority of these analytics platforms had adopted a fully cloud-based architecture. Specifically, only two vendors had transitioned to a cloud-native model. Most of the solutions were still grounded in traditional on-premises infrastructures, frequently relying on distributed processing frameworks such as Hadoop, which were deployed within the data centers of client organizations. Although the trend toward cloud computing has accelerated in recent years, the reality remains that many enterprise environments still operate hybrid systems or maintain legacy infrastructure—highlighting the slow pace of transformation in certain sectors.
Gartner contributes to the decision-making process of enterprise clients by publishing detailed market analyses and producing tools such as the Magic Quadrant. This strategic visualization classifies technology providers based on two primary dimensions:
- their ability to execute (which generally correlates with market presence and operational maturity)
- their completeness of vision (which relates to innovation and strategic direction).
Interestingly, Gartner’s reports emphasize that despite the proliferation of advanced analytics capabilities, reporting remains the most widely adopted function within BI platforms. This reflects a historical continuity in user behavior dating back to the 1990s. However, a shift is increasingly evident: organizations are now seeking broader and more sophisticated analytical functionalities, such as predictive analytics, data visualization, and self-service tools. These additions have been linked to higher levels of customer satisfaction, as they empower business users to derive more actionable insights from data without depending solely on IT specialists.
A significant organizational challenge is how to democratize access to analytic capabilities—particularly how to place these tools directly into the hands of non-technical business users. This concern ties directly into the broader framework of knowledge extraction and the value chain of analytics, where the transformation of raw data into actionable insights is a multi-step process involving data collection, preprocessing, analysis, interpretation, and decision-making.
The Data and Analytics Value Chain

Organizations frequently engage with various external providers to navigate the intricate landscape of data and analytics, as this domain is characterized by a complex value chain within the IT services market. At the apex of this structure is the end-user company, which requires data analysis, model training, and process redesign to derive actionable insights from its data. To achieve these objectives, end-user companies typically collaborate with multiple vendors, with consulting firms, often acting as system integrators like Accenture or PwC, serving as the primary point of contact. These large consulting companies bundle services from various other actors, ensuring the end-user company acquires the appropriate software (e.g., SAP, Oracle for data storage) and hardware infrastructure (e.g., in-house data centers, multiple cloud providers) necessary for data analysis.
Role and Specialization of Consulting Firms
The IT service ecosystem also includes smaller consulting companies that thrive on specialization, carving out niches in specific competencies due to their limited size and generalist capabilities. These firms offer highly specialized services where they are considered best-in-class, often being engaged by larger consulting companies. While some smaller firms may directly secure contracts with end-user companies, the prevailing model involves larger consulting firms integrating these specialized providers into their service offerings.
This arrangement allows larger firms to scale their operations without incurring the overhead of hiring and managing a vast array of in-house specialists. However, this intermediation invariably increases the cost of services across the value chain, as each layer adds its own markup. Even without direct technical involvement, aggregators like large consulting firms add value by simplifying the complex transactional and managerial burden that end-user companies would otherwise face in dealing with numerous disparate providers. The sheer volume of applications and providers—often hundreds—necessitates such simplification, as managing these complexities can be overwhelming and lead to a loss of the broader strategic vision for IT.
The role of large consulting companies as aggregators is crucial for simplifying IT management, a key selling point in their value proposition. The inherent complexity of modern IT environments, characterized by diverse infrastructures, standards, and programming languages, makes direct management by end-user companies exceedingly difficult.
For instance, managing 150 or more contracts and relationships with various providers requires significant time and effort, often diverting focus from core business activities.
This drive for simplification is akin to models seen in e-commerce, where platforms like Amazon aggregate different sellers and services, streamlining the customer experience.
In the data and analytics sector, system integrators adopt a similar approach, presenting integrated solutions to companies grappling with a fragmented and complex IT landscape. They address the “mess” by advocating for fewer applications and standardized environments, which can also lead to vendor lock-in through specific technologies or programming languages.
Specialized Experience vs. Theoretical Knowledge in Programming
While a common misconception among developers is that language proficiency is universal and adaptable across all systems, the practical reality highlights the significance of specialized experience. Developers frequently encounter “magic formulas” or specific configurations required to make software function correctly within particular environments. This practical experience, though not always theoretically complex, is invaluable in quickly resolving issues and delivering solutions.
Example
For example, a developer highly proficient in Microsoft .NET may struggle when placed in a different environment, even if they are a capable programmer. This need for diverse and specialized competencies often exceeds an end-user company’s capacity to maintain in-house. Consequently, companies frequently contract external consulting firms for on-demand specialized support, such as a .NET programmer for a specific transition or occasional troubleshooting.
The contemporary programming paradigm increasingly emphasizes the use of frameworks and reusable components to accelerate development and simplify complex tasks. Frameworks offer high-level primitives for common functionalities, such as workflow management, allowing programmers to design applications more rapidly without delving into the intricate underlying implementations. However, this convenience comes at a cost: reduced efficiency and increased resource consumption. Each layer of abstraction introduced by a framework can lead to delays in response times and higher computational overhead. While frameworks simplify development and abstract complexity, they limit direct control over performance optimization.
If a framework-based solution proves inefficient, the options for improvement are often limited to replacing components or, in extreme cases, abandoning the framework and rebuilding from scratch. There is a growing concern that this reliance on frameworks might diminish developers’ fundamental ability to build solutions from the ground up, leading to a dependency on external tools and potentially hindering the development of truly optimized systems.
The ongoing debate between developing solutions from scratch for maximum efficiency and control versus utilizing frameworks for speed and simplicity underscores a fundamental tension in software engineering. Achieving a balance between these approaches is crucial. While frameworks offer clear advantages in rapid prototyping and reducing managerial complexity, they can also lead to performance bottlenecks and restrict customization options. The ability to “open the hood” and tweak framework functionalities, or even build components from scratch when necessary, is a valuable skill that ensures greater control and efficiency.
The Resurgence of Niche Specialization and Foundational IT Skills
The current emphasis on startups in the IT sector may reflect a broader market desire to revert to more fundamental, efficient, and “low-level” information technology. This shift, driven by a perceived over-reliance on intermediation and simplification, seeks to re-emphasize direct coding, high efficiency, and deep technical competencies. For smaller consulting companies, niche specialization remains a viable strategy for survival and growth. By focusing on a narrow, clearly defined area of expertise, these firms can establish credibility and demonstrate their capabilities, even if they initially rely on partnerships with larger entities for visibility.
Despite their specialized expertise, these smaller companies often remain somewhat invisible to end-user companies, always being intermediated by larger firms that bridge the gap between complex technical details and business user needs. This intermediation, while simplifying interactions for end-users, can create a sense of unfairness for the smaller, highly technical firms.
Open Source and Make-or-Buy Dynamics
The IT landscape is in a constant state of flux, characterized by a dynamic interplay of factors that influence the “make-or-buy” decisions within organizations. While change is perpetual, its pace is often slow. A significant trend impacting this dynamic is the increasing emphasis on open source technologies.
- The adoption of open source tends to ebb and flow in waves, often correlating with shifts in the make-or-buy balance. When organizations lean towards in-house development (“make”), open source gains prominence as it provides readily available, customizable tools and frameworks.
- Conversely, when the preference shifts towards acquiring external solutions (“buy”), the perceived value of open source may temporarily diminish.
This cyclical nature notwithstanding, the growing maturity and availability of open source technologies, particularly frameworks developed by smaller, agile companies to address specific practical problems, are gradually shifting the balance. These efficient, problem-solving solutions become attractive options for acquisition, although the integration of such changes into established corporate IT ecosystems is a protracted process, demanding time and strategic planning.
End-User Companies: Navigating Business Innovation with Data Analytics
End-user companies face distinct challenges in leveraging data and analytics for business innovation, often stemming from internal organizational dynamics and a prevailing short-term financial outlook. A key impediment is the political validity within hierarchical structures, where decisions are often driven by established authority rather than purely data-driven insights. This can lead to a “survival mode” mentality in larger corporations, where the emphasis is on maintaining the status quo rather than embarking on ambitious, long-term data-driven business process re-engineering.
Instead of fundamentally rethinking core functions in light of emerging technologies like Artificial Intelligence (AI)—especially within a pragmatic 5-10 year horizon—companies frequently seek quick fixes that offer immediate, tangible business value without necessitating significant organizational overhaul. This often translates into adopting AI applications in non-core areas, largely for demonstrative purposes, rather than integrating AI where it could drive transformative change. The reluctance to embrace long-term organizational change is often linked to an economic environment that favors immediate financial returns and a corporate culture that prioritizes short-term financial metrics over entrepreneurial vision.
Despite these challenges, the strategy of implementing “quick fixes” in data and analytics serves a vital purpose: raising awareness and building an organizational culture receptive to data-driven transformation. By demonstrating the immediate benefits and capabilities of data analytics through smaller, focused projects, computer engineers can build internal knowledge and confidence within the end-user company. This initial exposure to the practical applications of technologies like machine learning is crucial for enabling future strategic planning.
Practical Applications of Data-Driven Business Process Re-engineering
Examples of such “quick fixes” abound, particularly in areas like personalized promotions. Consider the common scenario of supermarket coupons: traditionally, these were often generic and offered discounts on products customers had no interest in, leading to low redemption rates. By leveraging customer data, specifically through loyalty programs and purchase history, retailers can implement automated systems to generate personalized coupons. This involves applying business rules to avoid discounting items already purchased and instead focusing on products that customers might be inclined to buy in the future or to encourage repeat purchases. This approach not only enhances customer engagement but also provides a concrete demonstration of how data analytics can directly impact the bottom line. It empowers marketing teams to shift their focus from generic discounts to data-informed strategic promotions, yielding measurable financial returns and building trust in the capabilities of data-driven systems.
Beyond retail, the application of predictive analytics is exemplified by companies like Amazon, which famously patented an algorithm for pre-shipping goods based on anticipated demand. This proactive approach, anticipating customer needs even before an order is placed, minimizes delivery times and enhances customer satisfaction. Similarly, the German national football team’s victory in the 2014 World Cup was attributed, in part, to their use of data analytics to optimize player performance and dramatically reduce decision-making and ball-passing times during matches, showcasing the power of machine learning in high-performance environments.
The Insourcing Trend
A notable shift in the IT landscape is the growing trend toward insourcing, a reversal from the previous emphasis on purchasing packaged solutions like Enterprise Resource Planning (ERP) systems. The current inclination is for companies to develop their own proprietary software, building in-house capabilities to directly support their core business operations. This trend reflects a re-evaluation of the “make-or-buy” balance, where organizations increasingly opt to “make” rather than “buy” certain IT functionalities.
For a startup founded today, the decision to use cloud services over building an in-house data center is almost a given, highlighting the prevailing ease of access, low entry barriers, and pay-as-you-go models offered by cloud providers. However, for established companies, transitioning from legacy systems with deeply embedded processes and dedicated IT infrastructure presents a significant challenge. This often leads to a hybrid approach, where new workloads are deployed in the cloud while existing systems remain in on-premise data centers, necessitating complex management of both environments.
For companies with existing data centers and IT personnel, navigating the make-or-buy decision is complex.
- Consolidation of existing data centers is often the first step, optimizing resource utilization and reducing operational costs. This centralization of infrastructure and competencies can lead to significant savings, improved efficiency, and enhanced disaster recovery capabilities.
- Once operational consolidation is achieved, companies then determine which services to procure externally (e.g., cloud infrastructure) and which to maintain in-house. A common strategy is to outsource infrastructure to cloud providers, significantly reducing project completion times and minimizing the need for extensive in-house technical expertise related to hardware management. This allows existing IT personnel, who are accustomed to managing server farms, to transition their skills to managing cloud-based resources, effectively re-employing their technical competencies in a more agile environment.
The Strategic Imperative of Internal Analytics
The core of data analysis, analytics, and model development is increasingly being retained in-house due to its strategic importance. This is particularly evident in areas where a company’s unique competitive advantage or “footprint” is embedded in its data-driven strategies.
While external consultants can provide valuable insights, they often lack the in-depth understanding of proprietary data and the intrinsic business sense necessary to extract truly hidden knowledge and translate it into actionable strategies. Performing analytics in-house fosters a closer relationship between the data analysts and the business units that utilize these insights, leading to more accurate results and greater business benefit. This synergy between those who run the analytics and those who use them is critical for truly leveraging data to drive strategic decision-being. The strategic nature of sophisticated data analytics, which directly informs core business processes and competitive positioning, makes it a prime candidate for insourcing, ensuring that critical intellectual capital and decision-making capabilities remain within the organization.
The ‘Data Science Group’ and Bridging the Skills Gap
A successful data and analytics project typically necessitates a diverse skill set encapsulated within a “data science group,” comprising at least three critical competencies: data scientist, data manager, and computer scientist. A data scientist, with strong business acumen, can execute analytics, but their effectiveness is limited without accessible and well-structured data. Tools like KNIME enable data scientists to build analytics visually with reduced or aggregated datasets, even with limited technical knowledge. However, if data needs to be extracted from disparate databases, integrated, and transformed into the requisite format (e.g., a dataset with a target variable and features), a data manager is indispensable. Furthermore, when the project requires developing custom software to extract data from complex systems beyond standard database queries, a computer scientist becomes crucial. This interdisciplinary approach is vital for project delivery.

A prevalent issue in the current market is a skill shortage among computer scientists in specific areas, despite an abundance of data scientists. The proliferation of user-friendly data science tools and libraries (e.g., in Python, KNIME) has democratized data analysis, enabling individuals with strong business sense but limited programming expertise to perform analyses. This ease of use means that simply knowing how to apply these tools is often sufficient, rather than understanding their underlying mechanisms. Consequently, while many can perform basic data analysis, companies struggle to find developers capable of building the complex, real-time data infrastructures required for advanced applications like personalized couponing, where immediate processing based on real-world inputs (like items in a shopping cart) is essential.
This skill shortage is exacerbated by a perceived disconnect between the job market’s needs and the aspirations of new computer science graduates. Many graduates seek “sexy,” cutting-edge projects and are less inclined towards fundamental development in less glamorous technologies like .NET or COBOL. This preference, often influenced by marketing trends and the perceived prestige of certain programming languages (e.g., Go), can lead companies to select IT solutions based on trends rather than pragmatic engineering needs. This poses a risk of engineers becoming replaceable if they prioritize trend-following over foundational problem-solving.
Moreover, the historical trend of outsourcing various IT functions—from data center management to software development and system integration—has led to a significant loss of in-house competencies within many organizations. Outsourcing infrastructure management results in a loss of infrastructure management competencies, outsourcing processing capacity leads to a loss of business continuity procurement skills, and so forth.
Managing a Big Data Project
Effective management of a data project begins with a thorough identification of key stakeholders, understanding their data ownership, information needs, and the types of insights that can benefit their respective business areas.
- Define Use Cases: The first step is to identify the specific use cases that will drive the project. This involves engaging with stakeholders to understand their pain points and how data analytics can address them. One critical step in this phase is the selection of the right use cases, the one with clearly defined business KPIs. This is crucial for demonstrating the value of data analytics to the organization and ensuring that the project aligns with business objectives.
- Determine the Project Team: Once the use cases are defined, the next step is to assemble a project team. This team should include individuals with the necessary skills and expertise to execute the project successfully. It is essential to identify any competency gaps that may require external resources, such as data scientists or consultants.
- Plan the Project: The project should be planned like any other, with clearly specified outcomes and measurable KPIs. This includes defining the scope of the project, establishing timelines, and identifying key milestones. It is crucial to ensure that the project is aligned with the overall business strategy and objectives.
- Define the Techinical Requirements: The technical requirements of the project should be clearly defined, including the data sources, tools, and technologies that will be used. This includes identifying any existing systems or platforms that will need to be integrated with the new analytics solution.
- Communicate Results: When reporting results to management, it is vital to communicate benefits in business terms (e.g., “coupon redemption rate increased by X%”) rather than solely focusing on technical details. While a brief mention of underlying technologies might be appropriate to convey technical competence, the emphasis must remain on the business impact. Furthermore, relying on a single KPI can be misleading; for instance, while a higher coupon redemption rate might seem positive, it also implies increased discounts. Therefore, it is essential to present a balanced set of KPIs, such as demonstrating that increased redemption rates are offset by successful upselling efforts, ultimately leading to a net positive financial outcome.