The Significance of Data Quality in Data-Driven Management
In today’s business landscape, where competition is fierce and digital transformation is at the forefront, data-driven management has emerged as a vital approach to enhancing organizational success. This management style revolves around the systematic collection, analysis, and application of data to guide decision-making. The core idea behind data-driven management is the recognition that data represents one of an organization’s most valuable assets. When leveraged effectively, data allows for refined decision-making processes, improved operational efficiency, and heightened productivity. However, the effectiveness of data-driven strategies depends heavily on the quality of the data itself. Without high-quality data, even the most sophisticated data analytics tools and strategies can lead to misguided insights and suboptimal business outcomes.
In a data-driven management approach, decision-making does not rely solely on intuition or historical precedence; instead, it is based on insights that emerge from meticulously analyzed data. This evidence-based approach helps organizations identify new opportunities, reduce risks, and respond swiftly to market shifts. Nevertheless, the value of this approach is realized only when data quality is prioritized. Poor data quality can distort insights, leading to decisions that may detrimentally impact the organization. Therefore, ensuring data quality is not merely a best practice; it is a critical enabler of successful data-driven management.
The GIGO Phenomenon
The GIGO (Garbage In, Garbage Out) principle is a well-known concept in data analysis and computer science, underscoring the importance of high-quality data in generating reliable outcomes. This phenomenon highlights that the quality of the output from any data analysis system is directly tied to the quality of the data inputted. Simply put, if an organization inputs flawed, inaccurate, or incomplete data into an analytics model, the insights and decisions generated will likely be unreliable or even misleading.
In data-driven decision-making, errors in the input data can have a “snowball effect,” where even minor inaccuracies can become amplified through successive stages of analysis. Such cumulative errors can significantly affect business strategies, ultimately leading to poor resource allocation, operational inefficiencies, or unmet organizational goals. Consequently, organizations must focus on not only the data they collect but also the processes they use to handle and interpret it. This entails maintaining rigorous standards for data quality at every stage, from acquisition to analytics and visualization. Data accuracy, completeness, consistency, and relevance must be regularly assessed to prevent the GIGO effect from undermining decision-making efforts.
Furthermore, addressing the GIGO phenomenon requires a structured data architecture that supports quality assurance throughout the data lifecycle. This architecture must facilitate comprehensive data management processes, including acquisition, extraction, cleaning, annotation, integration, analysis, modeling, interpretation, and visualization. Each of these phases must be carefully executed to prevent data quality issues from arising or compounding. By ensuring high data integrity at each stage, organizations can generate reliable, actionable insights that truly reflect reality.
Data Preparation in Big Data Management
Data preparation, encompassing activities like data cleaning, transformation, and integration, is foundational to effective data-driven management. Real-world data is often incomplete, inconsistent, and riddled with errors or redundancies. As a result, raw data is rarely suitable for immediate analysis; instead, it requires meticulous preparation to become reliable for analytic use. In fact, data preparation is estimated to constitute nearly 90% of the work involved in data mining applications. This intensive process includes identifying and rectifying errors, filling in missing values, standardizing formats, and ensuring overall consistency across data sources.
Effective data preparation not only enhances the accuracy of analysis but also enables seamless integration of data from diverse sources. This aspect is especially critical in big data environments where vast volumes of structured and unstructured data converge. A robust data preparation process facilitates the application of advanced analytics, artificial intelligence (AI), and machine learning (ML) algorithms by providing the clean, well-structured data that these models require to yield reliable predictions and insights. Moreover, by investing in data preparation, organizations can maximize the value of their analytics tools, empowering them to reveal patterns and trends that can lead to strategic advantages.
graph LR
  A[Aquisition]
  B[Extracting<br>Cleaning<br>Annotating]
  C[Integration]
  D[Analytics<br>Modeling]
  E[Interpretation<br>Visualization]

  subgraph 1[Big Data Management]
    direction LR
    A --> 2
    subgraph 2[Application of Statistics/AI/ML]
      direction TB
      B --> C
      C --> 3
      subgraph 3[Data Science]
        direction TB
        D --> E
      end
    end
  end
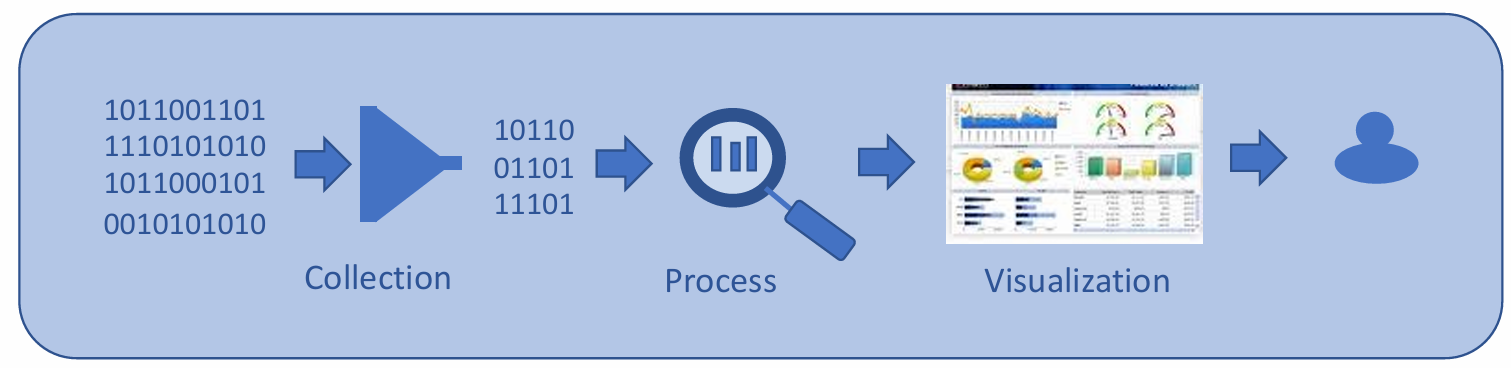
For organizations to fully harness data for strategic gains, they must build a sustainable data management infrastructure that supports the end-to-end data lifecycle. This involves multiple interconnected processes, from data acquisition to the visualization of results, often depicted as a flow through the stages of big data management, statistical analysis, and data science. In the initial acquisition phase, raw data is gathered from various sources. Following this, data undergoes extraction, cleaning, and annotation, ensuring that only high-quality, relevant information is retained. Integration consolidates this information into a unified dataset that can be analyzed effectively.
Once data is prepared, the analytics and modeling phase begins, where statistical techniques, machine learning models, and AI algorithms are applied to uncover insights and make predictions. Finally, interpretation and visualization make these insights accessible to stakeholders, enabling data-driven decisions that are backed by visualized evidence. Each stage of this process relies on a foundation of high-quality data, underscoring the significance of data preparation and quality assurance in achieving the overall goals of data-driven management.
Defining Data Quality
Definition
Data quality is traditionally defined as “fitness for use,” referring to a data collection’s ability to meet the requirements of its intended users. From an information systems perspective, data quality is further elaborated as the extent to which data meets user needs in terms of accuracy, timeliness, completeness, consistency, and relevance.
This emphasis on aligning data characteristics with user requirements forms the foundation of data quality management and directly influences the success of any data-driven initiative. The definition and management of data quality have become increasingly important due to the rapid expansion of data sources and the need for accurate and reliable data in decision-making processes.
Data Quality Management
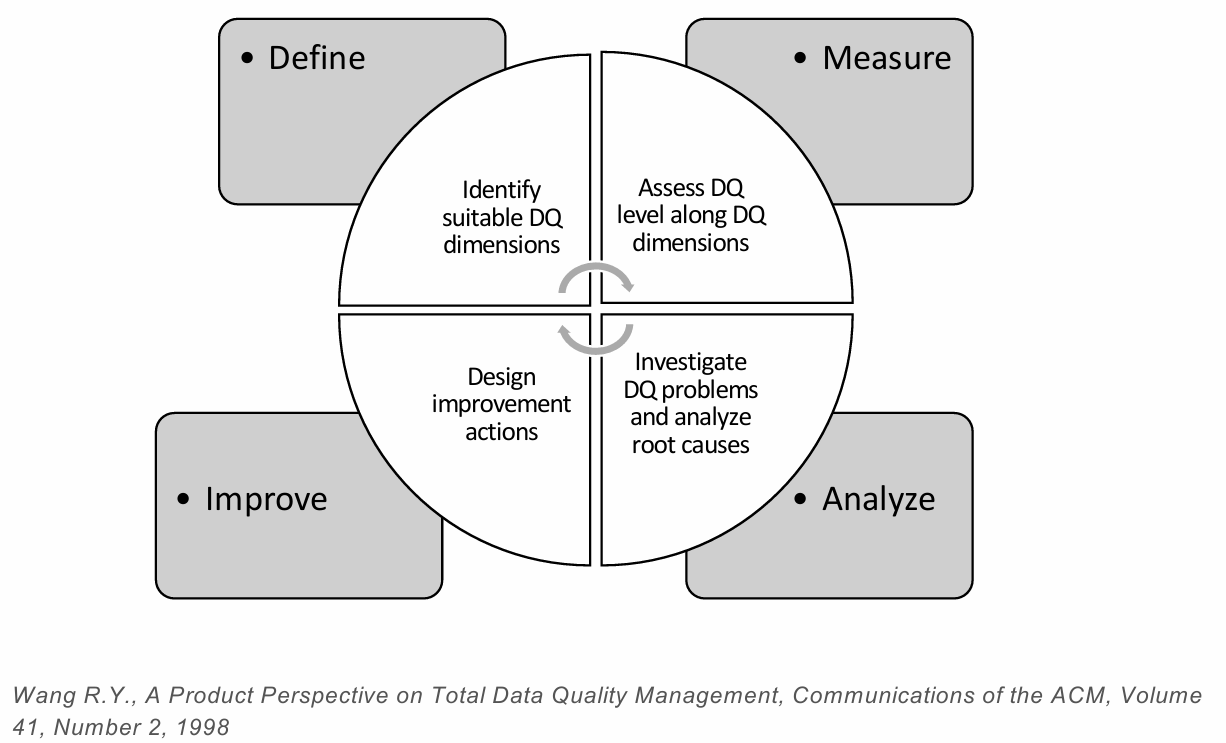
Effective data quality management entails several interrelated steps aimed at ensuring data remains accurate, consistent, and relevant throughout its lifecycle. This approach typically includes the following components:
- Quality Dimensions Definition: Establishing the key quality dimensions that define high-quality data for the organization. These dimensions may vary depending on the nature of the business and the specific analytical or operational goals.
- Quality Dimensions Assessment: Evaluating existing data against these defined dimensions to identify any areas where quality may fall short.
- Quality Issue Analysis: Investigating identified quality issues to determine their root causes, which could range from data entry errors to inconsistencies across datasets.
- Quality Improvement: Implementing solutions to address identified issues, thereby enhancing the quality and reliability of the data for current and future use.
Data Quality Dimensions
Data quality dimensions serve as objective criteria for evaluating data quality, each reflecting a specific attribute essential to ensuring data’s reliability and usability.
Definition
Accuracy: This dimension assesses the correctness and reliability of data. Within accuracy, we can differentiate between:
- Syntactic accuracy, which relates to the correct formatting and structure of data (e.g., dates in consistent formats).
- Semantic accuracy, which evaluates whether data aligns with real-world values or facts, such as a recorded location corresponding to the actual address.
Completeness: Completeness measures whether a dataset includes all necessary data to represent a corresponding set of real-world objects. Missing data fields (such as unlisted phone numbers or email addresses) are a common completeness issue, often leading to fragmented insights.
Consistency: Consistency ensures that data adheres to semantic rules defined across a dataset, such as maintaining uniform representations for similar data items. For example, recording “San Francisco” as “SF” in one entry and “San Fran” in another can cause inconsistencies.
Timeliness: Timeliness evaluates how up-to-date data is for a particular purpose. Data that is outdated or no longer relevant can lead to skewed analyses and poor decision-making outcomes, especially in dynamic fields like finance or healthcare.
Example
In practical scenarios, data quality is often affected by several recurring issues, each of which can significantly impact the usability of data. Below is an example dataset illustrating some common data quality issues and their implications:
| ID | Name | Street and House Number | Postcode | Town | Date of Birth | Phone | |
|---|---|---|---|---|---|---|---|
| 1 | Janet Gordon | 30 Fruit Street | 75201 | Dallas | |||
| 2 | Kathy Robert | 436 Devon Park Drive | 94105 | San Francisco | 08.08.1969 | 215-367-2355 | krob@robert.com |
| 3 | Sandra Powels | 3349 North Ridge Avenue | 33706 | St. Pete Beach | |||
| 4 | Jeffrey Johnstone | 3300 Sylvester Rd | 92020 | El Cajon | |||
| 5 | Ruth-Hanna Lowe | 25 Peachtree Lane | 02112 | Boston | 10.10.1950 | (0617) 8845123 | |
| 6 | Janet Gordon | 30 Fruit Street | 75201 | Dallas | |||
| 7 | Nick Goodman | Regional Campuses, 711 | 10020 | New York | 08/07/1975 | n.good@goodman.com | |
| 8 | Donna S. Poweles | 3347 North Ridge | 33706 | Saint Pete Beach | |||
| 9 | Cathy Robbert | 436 Devon Park Drive | 94105 | San Francisco | 08.03.1969 | ||
| 10 | Ruthanna Lowe | 25 Peachtree Lane | 02112 | Boston | 0617-8845123 | ||
| 11 | John Smith | 10 Main Street | 02112 | New York | |||
| 12 | Katrin Robert | 434 Devon Park | 94105 | San Francisco | |||
| 13 | Nick Goodman | 56 Grafton Street | 94105 | San Francisco | 08/07/1975 | n.good@goodman.com | |
| 14 | Sandro Powels | 3349 North Ridge Av. | 33706 | Pete Beach |
In this dataset, missing values are apparent in several rows, potentially limiting the insights that can be derived. Additionally, duplicate entries for similar names (e.g., Janet Gordon) and inconsistencies in name spellings (e.g., “Cathy Robbert” vs. “Kathy Robert”) complicate the interpretation and accuracy of analyses. Furthermore, format inconsistencies (such as various date formats) make it difficult to systematically analyze the data without extensive cleaning efforts.
In cases where data is sourced from multiple locations, additional quality issues can arise:
ID Flu Type Hospital Province Date Cost 1 Flu SR Milan 01/05/2008 200 2 Flu SR Milan 24/5/2008 180-220 3 Flu SR Milan 04/05/2008 9999 Here, outliers (such as an abnormal cost of 9999) and noise in the form of non-standard data entries (e.g., ranges in the “Cost” field) disrupt the analysis. Additionally, differences in date formats (e.g., “01/05/2008” vs. “2008/04/23”) present challenges in merging data from multiple sources. Inconsistencies in field names and values further hinder data integration, making it difficult to unify datasets for comprehensive analysis.
Data Quality Improvement Approaches
Improving data quality is a multi-faceted task that requires understanding both the data and the processes that generate it. Two primary approaches exist: data-based methods and process-based methods.
- Data-Based Approaches focus on the values within the dataset, seeking to identify and correct errors without regard for the processes or contexts in which the data will be applied. The objective is to analyze the data in isolation, correct inconsistencies, and refine the data set so it meets defined quality standards.
- Process-Based Actions aim to correct data quality issues by identifying the root cause of errors within the data generation or collection processes. These actions are typically triggered when errors occur, and the focus is on eliminating the sources of errors to prevent similar quality issues from recurring.
Data Cleaning
Data cleaning is essential to improving data quality, involving the systematic identification and elimination of inconsistencies, discrepancies, and errors in a dataset. This process ensures that data is standardized, free of duplications, and consistent across fields. The typical steps in data cleaning can be represented as follows:
graph TD
  A[Data Collection/Selection]
  B[Data Profiling]
  C[Standardization/<br>Normalization]
  D[Error<br>Correction]
  E[Duplicate<br>Detection]
  F[Data Quality Assessment]

  A --> B --> 1

  subgraph 1[Data Cleaning]
    direction LR
    C --> D
    D --> E
  end

  1 --> F
In cases where data is collected from multiple sources, additional integration steps are necessary to unify the data into a single, reliable dataset. The data integration process involves the following steps:
graph LR
  A[Schemata Alignment] --> B[Entity Reconciliation] --> C[Data Fusion]
During data fusion, conflicting values between sources must be identified and resolved, ensuring that the final dataset accurately represents the combined information.
Data Profiling
Data profiling is a preliminary step in data cleaning, involving a detailed analysis of the dataset’s structure and content. It examines attributes, dependencies, and relationships within and across data tables to identify issues like redundancies and missing values. Key elements of data profiling include:
- Content and Structure Analysis:
Evaluating data types, domains, distributions, and the occurrence of
nullvalues. This also includes checking the uniqueness and format (e.g., “mm/dd/yyyy”) to ensure consistency. - Attribute Dependency Analysis: Reviewing dependencies within attributes in a single relation to identify primary key candidates and verify functional dependencies.
- Overlapping Attributes Analysis: Identifying redundancies or foreign key relationships across different tables to understand how attributes relate across datasets.
For a robust data profile, quantitative measures such as missing value counts, expected versus actual cardinality, variance, and the frequency of null values are assessed. Duplicates are also quantified to understand the extent of redundancy.
In practice, data profiling can be efficiently conducted using Python and data profiling libraries like Ydata profiling (formerly pandas-profiling). This library automates data profiling, providing an in-depth report on data quality aspects such as missing values, correlations, and distribution, making it easier to identify and address potential issues. Example code for data profiling with Ydata profiling:
import pandas as pd
import pandas_profiling

# Load dataset
data = pd.read_csv('data.csv')

# Generate profile report
profile = data.profile_report(title='Data Profiling Report')
profile.to_file("data_profiling_report.html")
Data cleaning is essential for refining data quality, transforming raw data into a reliable resource for analysis. Cleaning tasks focus on addressing inconsistencies, standardizing data formats, handling missing values, and detecting duplicates or outliers. These tasks are critical in preparing data for analysis, minimizing errors, and improving the accuracy of results.
Normalization and standardization ensure that data across different sources adheres to a common format, facilitating consistency and interoperability. This process often includes:
- Data Type Conversion: Changing data types to ensure compatibility, such as converting
varchartointwhere applicable. - Normalization: Mapping values into a common format, crucial for attributes like dates, currency, and name formats:
- Dates can be normalized from various formats (e.g.,
03/01/15to01-MAR-2015). - Currency values may be converted to a consistent unit (e.g., USD to EUR).
- Tokenizing names, transforming “Smith, Paul” to distinct tokens like “Smith” and “Paul” for consistent naming.
- Dates can be normalized from various formats (e.g.,
- Discretization of Numerical Values: This step involves categorizing continuous numerical data into discrete intervals, improving interpretability.
- Domain-Specific Transformations: Adapting data based on domain knowledge can add value. For example:
- Standardizing address terms like “St.” to “Street” using address databases.
- Converting specialized product codes to general names in fields like pharmaceuticals.
Error localization and correction identify and address inconsistencies within the data, refining the dataset’s integrity and accuracy.
- Inconsistency Correction: By establishing a consistent set of validation rules or “edits,” syntactic accuracy checks can identify mismatches, spelling errors, or improper formats. Errors found in this way may require re-collection or additional data acquisition to maintain accuracy.
- Incomplete Data Correction: Identifying incomplete data and filling gaps or reformatting partial information can significantly enhance the data quality.
- Outlier Localization: Outliers are extreme data values that deviate from the pattern in a dataset and may indicate data entry errors or genuinely unusual events.
Missing data can occur at multiple levels, posing unique challenges and impacting the accuracy of analysis if not addressed.
- Instance-Level Issues: Missing data can manifest in values, tuples, or even whole fragments. Deciding whether a missing value represents an unknown or a default value can significantly affect data interpretation.
- Schema-Level Issues: Missing attributes or structural fragments may require adjustments to the schema or supplemental data sources.
To address missing data without skewing the dataset, unbiased estimation techniques, such as calculating mean or variance, are useful. Techniques for treating missing values include:
- Unbiased Estimators: Approaches like using the median or mode fill in missing data without altering dataset characteristics.
- Exploiting Functional Dependencies: Known relationships between variables (e.g., the number of bedrooms as a predictor of income) provide insight into reasonable estimates for missing data.
- Statistical Techniques: Models such as linear regression or more complex methods (e.g., neural networks) can predict missing values based on correlations within the data.
Outliers represent data points that deviate significantly from other observations, often requiring special attention to determine whether they reflect errors or significant, real-world events.
- Detection: Techniques based on distribution analysis, geometry (e.g., distance from the cluster center), and time series analysis help identify outliers.
- Interpretation: Differentiating between data-entry errors and genuine anomalies is crucial. Understanding the nature of the outlier helps determine whether it should be excluded or flagged as significant.
Duplicate detection, also known as entity reconciliation, identifies multiple records representing the same entity. This process involves:
- Similarity Measures: Identifying duplicates often relies on calculating similarity measures between records. For example, Levenshtein distance or Jaccard similarity coefficients can help compare strings for resemblance.
- Comparison Optimization: Reducing the number of comparisons minimizes processing time and resources, especially with large datasets. Techniques such as blocking (grouping similar entities) and indexing are commonly used to streamline duplicate detection.
Duplicate detection is essential in ensuring each real-world entity is represented once within the dataset, improving data reliability and interpretability.
High-Level Process for Data Quality Improvement
In a structured data quality improvement process, we aim to refine data through multiple stages, ensuring that the resulting data is both accurate and useful for analysis.
- Input Files: Two datasets,
and , serve as input files containing raw data. - Preprocessing: The initial step involves preprocessing each file separately to clean and standardize the data, preparing it for further steps.
- Search Space Reduction: Here, we narrow down the search space between the datasets, reducing computational complexity by filtering out unlikely matches from the Cartesian product
. - Refined Search Space (
): After reduction, a subset of is created, containing only the most probable matches. - Comparison and Decision: Each pair within the subset
undergoes comparison based on similarity measures, and a decision is made about the matching status: - Match: Identified matches go through a final quality assessment to confirm accuracy.
- Possible Match: In cases of uncertainty, pairs may need further review before classification.
- No Match: For pairs that do not meet similarity criteria, they are discarded as non-matches.
- Quality Assessment: Post-processing quality checks validate and ensure the reliability of matches, refining the dataset further for use in downstream processes.
graph TD
  file1((Input<br>file A))
  file2((Input<br>file B))
  A[Preprocessing<br>on A and B]
  B[Search Space<br>Reduction on A × B]
  C((Space Search<br>C ⊆ A × B))
  D[Comparison and Decision]
  E((Match))
  F((Possible<br>match))
  G((No<br>match))
  H[Quality<br>Assessment]

  file1 --> A
  file2 --> A

  A --> B --> C --> D
  D --> E --> H --> A
  D --> F --> H --> B
  D --> G --> H --> D
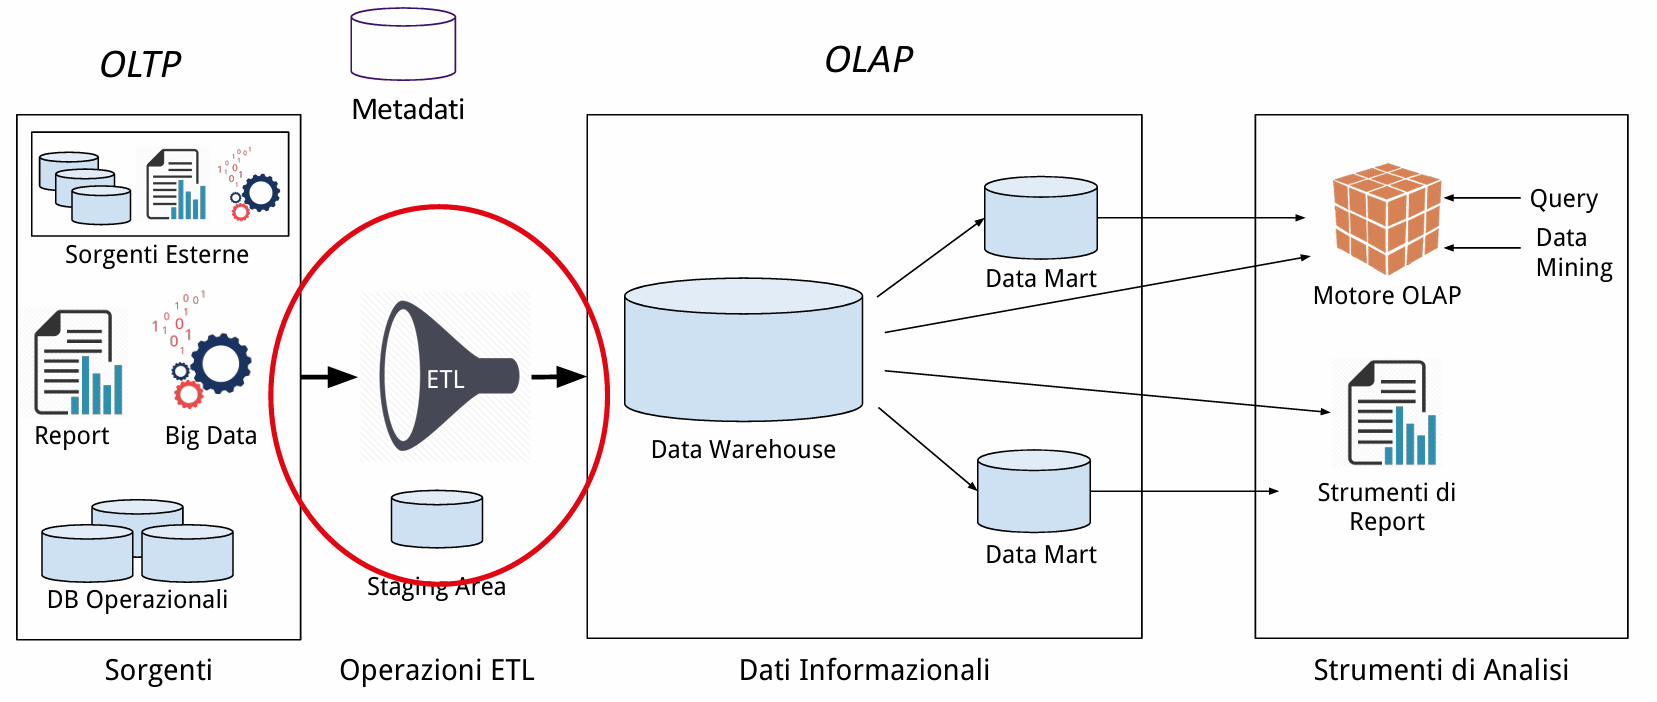
This iterative approach, including feedback loops at every decision stage, reinforces data quality improvements across multiple stages and is commonly applied in systems like data warehouses to standardize and validate large volumes of incoming data.
Big Data and Data Quality
In big data environments, the sheer scale and complexity of data present unique challenges for data quality management, encapsulated by the “four V’s” of big data:
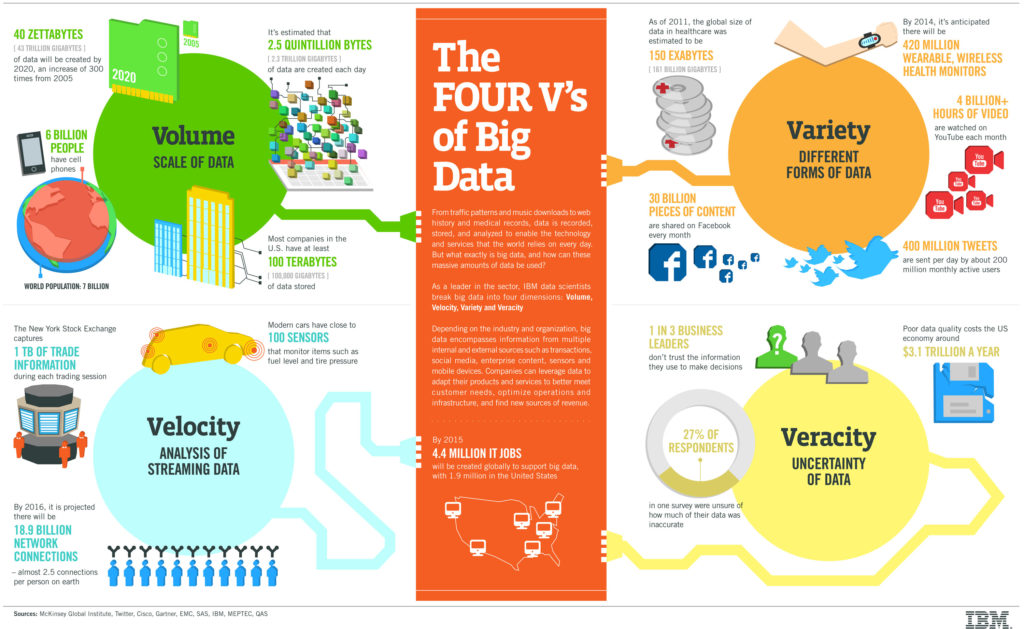
- Volume: The vast amount of data generated presents scalability issues for storage, processing, and quality checks. Ensuring data quality through profiling, cleaning, and assessment becomes computationally intensive and time-consuming due to the large data volumes.
- Velocity: The rapid pace of data generation and the need for real-time processing necessitate adaptive and efficient quality management solutions. Continuous data generation demands real-time processing; delays in collecting, cleaning, or analyzing data can lead to outdated insights.
- Variety: Data originates from a diverse range of sources, encompassing structured, semi-structured, and unstructured formats (such as IoT sensor data and social media feeds), making integration and consistency difficult. Integrating data from numerous internal and external sources, including IoT and sensor data, poses challenges for traditional ETL (Extract, Transform, Load) tools, which are less effective given the scale and speed.
- Veracity: Ensuring data reliability and accuracy across varying data types, sources, and forms of structure remains a significant quality challenge. While standards for traditional data quality exist, big data presents unique challenges in structuring and verifying the data’s reliability, accuracy, and timeliness.
High-quality data is fundamental to deriving accurate, actionable insights from big data analytics. Big data analysis allows organizations to predict customer needs, improve service quality, and anticipate risks. However, attempts to offset data quality issues by increasing data quantity have limitations, as low-quality data can still degrade analytical outcomes.
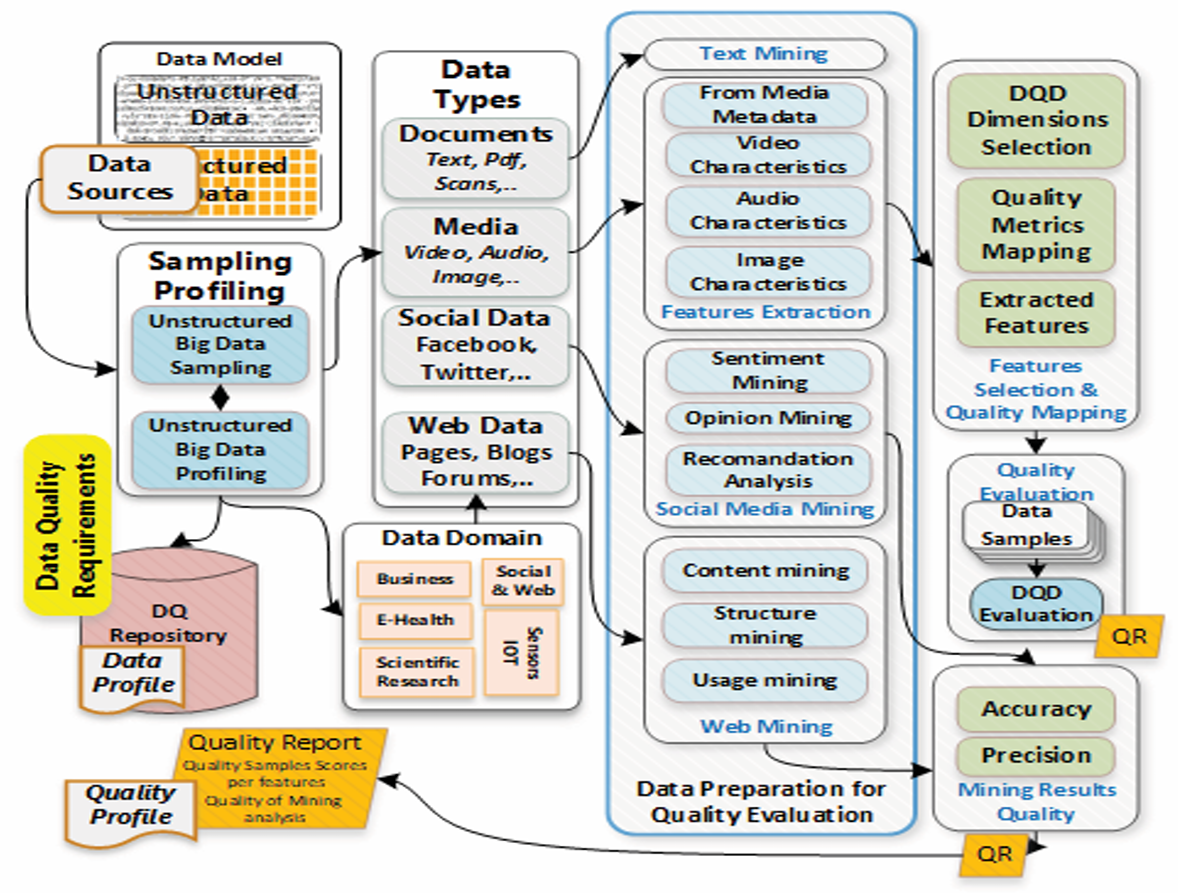
Given the unique challenges posed by unstructured data, a specialized quality assessment model is required for big data, focusing on the inherent variety, velocity, and volume while maintaining veracity. This model addresses data inconsistencies, ambiguity, and integration issues, ensuring that big data analytics yield high-quality, actionable insights.