Data Revolutions
Over the past decade, data has played an increasingly central role in shaping businesses, technology, and decision-making processes. In this period, we have witnessed four major data revolutions that have significantly altered how organizations collect, analyze, and utilize data. These revolutions—Big Data, Machine Learning, Deep Learning, and now the Generative AI—have each contributed to the advancement of modern artificial intelligence and data-driven strategies.
gantt
    title Data Revolutions
    dateFormat  YYYY
    axisFormat %Y

    Big Data :done, a1, 2012, 2015
    Cloud Computing :done, a2, 2014, 2017
    Machine Learning :done, a3, 2015, 2018
    Deep Learning :done, a4, 2018, 2021
    Generative AI :active, a5, 2021, 2025
Big Data (2012-2015)
The first major transformation in the data landscape occurred between 2012 and 2015, when “Big Data” became a defining term in the technological and business worlds.
Definition
Big Data refers to the massive volumes of structured and unstructured data generated daily, which traditional data processing tools struggled to manage.
The challenge was not only in collecting this vast amount of information but also in storing, organizing, and analyzing it to extract meaningful insights.
Example
Consider how companies like Amazon operate: every user interaction—such as clicks on a website, searches, orders, and even time spent on product pages—generates data. Additionally, companies with physical stores collect data from warehouses, logistics, and in-store purchases. The sheer volume of data collected from multiple sources meant that businesses needed new tools and strategies to process information efficiently.
Before the Big Data revolution, many companies made decisions based on intuition or limited datasets. The introduction of scalable storage solutions like Hadoop and NoSQL databases allowed businesses to aggregate data from various departments into centralized repositories. This shift enabled companies to make data-driven decisions, improving efficiency and customer personalization.
Furthermore, Big Data transformed the way organizations viewed unstructured information. Traditionally, databases focused on structured data stored in relational tables. However, companies soon realized that valuable insights could also be derived from unstructured sources, such as emails, social media interactions, and multimedia files. Today, even simple text documents, PowerPoint presentations, and PDFs contain valuable information that artificial intelligence can process, allowing users to extract key insights without manually reviewing vast amounts of material.
The Machine Learning Revolution (2015-2018)
Following the Big Data revolution, the period from 2015 to 2018 saw the rapid advancement of machine learning. This technology built upon the foundation of Big Data, utilizing mathematical models and statistical algorithms to identify patterns, make predictions, and automate decision-making processes.
Definition
Machine Learning involves the development of algorithms and statistical models that enable computers to perform tasks without explicit programming. It is a subset of artificial intelligence (Al) that focuses on the ability of systems to learn and improve from experience.
One of the key advantages of machine learning is its ability to reduce human bias in decision-making. Traditional methods often relied on human intuition, which could introduce inconsistencies or errors. Machine learning models, on the other hand, analyze data systematically, identifying trends that might go unnoticed by human analysts.
Some of the most influential machine learning techniques include:
- Clustering: This method groups similar data points together based on their characteristics. For instance, companies like Amazon use clustering to segment customers into different categories based on their purchasing habits. This allows for targeted marketing strategies, where recommendations are tailored to specific customer groups.
- Reinforcement Learning (RL): Unlike traditional machine learning methods, reinforcement learning involves algorithms that learn from interactions with an environment. This approach is commonly used in recommendation systems, such as Netflix’s personalized movie suggestions. The algorithm continuously refines its predictions based on user feedback, improving the accuracy of recommendations over time.
- Neural Networks: Inspired by the structure of the human brain, neural networks are a class of algorithms that excel at recognizing complex patterns. These models paved the way for deep learning, which further enhanced the capabilities of artificial intelligence.
Machine learning fundamentally changed how businesses approach automation, allowing for real-time predictions, fraud detection, and improved customer experiences. Its impact extended beyond the corporate world, influencing fields such as healthcare, finance, and cybersecurity.
The Deep Learning Era
Building on the advancements of machine learning, deep learning emerged as the next evolutionary step in artificial intelligence. Deep learning refers to a subset of machine learning that uses multi-layered neural networks to process data. These networks can analyze vast amounts of information and extract hierarchical features, making them particularly effective for complex tasks such as image recognition, natural language processing, and autonomous driving.
Unlike traditional machine learning models, which rely on manually engineered features, deep learning algorithms automatically learn representations from raw data. This capability has led to breakthroughs in various domains, including:
- Computer Vision
- Natural Language Processing (NLP)
- Speech Recognition
Deep learning has also played a crucial role in advancing generative AI, which can create realistic images, videos, and even human-like text. The ability of deep learning models to handle unstructured data has made them indispensable for businesses seeking to automate complex processes.
The Cloud Revolution (2014-2017)
The cloud revolution represents a paradigm shift in the way organizations manage data, computation, and infrastructure. Historically, companies relied on on-premise solutions, meaning that their data and applications were hosted on physical machines located within their own facilities. This approach required dedicated IT departments to handle hardware maintenance, storage management, and system scalability, which often led to significant operational costs and inefficiencies.
Definition
Cloud Computing is a technology that provides on-demand access to a shared pool of computing resources, such as servers, storage, and applications, over the internet.
Companies no longer needed to invest in and maintain expensive physical servers; instead, they could leverage cloud providers such as Amazon Web Services (AWS), Google Cloud Platform (GCP), and Microsoft Azure to dynamically allocate resources based on their needs. This shift offered major advantages, including scalability, cost-effectiveness, and flexibility.
This transition has also introduced a new challenge: financial operations in cloud environments. While cloud computing removes the burden of infrastructure maintenance, it introduces the need for cost monitoring and optimization. Cloud providers operate on a pay-as-you-go model, meaning that costs can quickly escalate if resources are not managed efficiently. This has led to the rise of FinOps (Financial Operations) teams, which focus on monitoring cloud expenses, setting up automated alerts, and optimizing resource allocation to prevent excessive spending.
Additionally, cloud computing enables various as-a-service models, which provide pre-configured services without requiring direct infrastructure management. These models include:
- Infrastructure as a Service (IaaS) – Virtual machines, networking, and storage solutions that replace traditional hardware.
- Platform as a Service (PaaS) – Development environments that include pre-configured operating systems, databases, and runtime environments.
- Software as a Service (SaaS) – Fully managed applications such as Google Drive, Microsoft Office 365, and Salesforce.
The Rise of Generative AI
We are currently experiencing another technological revolution: Generative AI. This field of artificial intelligence focuses on creating new content by leveraging deep learning techniques. Generative AI has disrupted multiple industries, allowing businesses and individuals to automate complex tasks, enhance creativity, and improve decision-making processes.
The power of generative AI extends beyond text-based applications. Organizations are now leveraging synthetic data generation to train machine learning models in scenarios where real-world data is limited. This process, known as data enrichment, involves creating artificial datasets that mimic the statistical properties of real-world data. This approach is particularly useful in fields such as medical research, fraud detection, and autonomous systems, where gathering large amounts of real data is challenging or expensive.
A critical development in generative AI is the emergence of Small Language Models (SLMs). Unlike LLMs, which are trained on diverse datasets to handle a broad range of queries, SLMs are optimized for specific domains. These models offer several advantages, including reduced computational requirements, lower latency, and improved performance in specialized tasks.
One of the most impactful applications of generative AI is Retrieval-Augmented Generation (RAG). This approach enhances large language models by integrating information retrieval systems, such as Elasticsearch or vector databases. Traditional LLMs generate responses based on pre-trained knowledge, which can become outdated. RAG models, however, dynamically fetch the latest information from external sources, ensuring that responses are both accurate and contextually relevant. This technique is particularly valuable in enterprise environments, where AI models need to operate on proprietary datasets, regulatory documents, or specialized knowledge bases.
Generative AI is not just a trend; it is a foundational shift that will continue to shape industries, enabling companies to automate workflows, improve decision-making, and unlock new business opportunities.
Data Framework
Definition
A data framework is a structured approach to treating data as a valuable asset, enabling organizations to extract meaningful insights and drive business value.
This framework is designed to handle data in a way that is both suitable and comfortable for a company, ensuring that data can be leveraged effectively across various business functions. At its core, the data framework is built to address the challenges of managing raw data, integrating diverse data sources, and transforming this data into actionable insights.
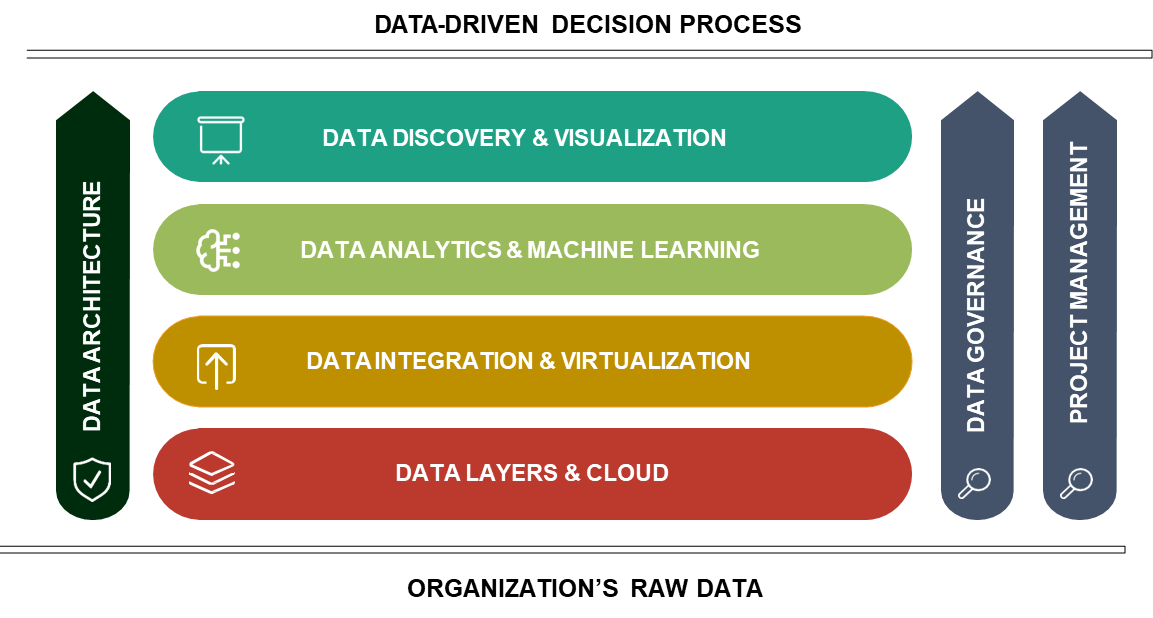
At the foundation of the data framework lies raw data, which encompasses all the information an organization collects. This includes unstructured data such as documents, PowerPoint presentations, and PDFs, as well as structured data from operational systems like retail shops, e-commerce platforms, HR systems, and service platforms.
One of the primary challenges with raw data is its fragmented nature. Data from different sources often does not communicate with each other, even when it pertains to the same individual or entity. This lack of integration makes it difficult to perform comprehensive analyses, such as understanding customer behavior across both physical and digital channels. As a result, raw data, while abundant, often exists in silos, making it challenging to derive meaningful insights without significant effort. This is where the data framework steps in, providing a structured pathway to integrate, model, and analyze data effectively.
Data Integration and Preparation
The first two steps in the data framework focus on data integration and preparation. These steps are critical for transforming raw data into a usable format. The process begins with capturing all available data and consolidating it into a centralized data layer, which could be a cloud-based system or an on-premise data warehouse. Once the data is centralized, it undergoes a process of modeling and virtualization. This involves structuring the data in a way that aligns with the organization’s analytical needs, ensuring that it can support various use cases.
For instance, data integration might involve linking a customer’s in-store purchases with their online transactions, creating a unified view of their behavior. This preparation phase often involves the use of Extract, Transform, Load (ETL) processes, which are automated workflows that collect, clean, and organize data on a regular basis. These ETL jobs typically run overnight or during off-peak hours to ensure that the data is ready for analysis by the time business users need it. By the end of this phase, the data is structured in a way that allows for seamless analysis, enabling the organization to answer complex questions, such as identifying customers who shop both online and in-store.
Data Analytics and Machine Learning
Once the data is integrated and prepared, the next layer of the framework focuses on data analytics and machine learning. This is where the true value of the data is unlocked. Advanced analytical techniques and machine learning algorithms are applied to the prepared data to address specific business needs. For example, clustering algorithms can be used to segment customers based on their purchasing behavior, while predictive models can forecast future sales or recommend products to individual customers.
This layer relies heavily on the quality and structure of the data prepared in the previous steps. For instance, if the data accurately links a customer’s in-store and online purchases, machine learning models can provide personalized recommendations that span both channels. This level of insight is invaluable for driving business growth, improving customer satisfaction, and optimizing operations.
Data Visualization and Business Insights
The final layer of the data framework is data visualization and discovery. This layer is crucial for translating complex data into actionable insights that can be easily understood by decision-makers. Visualization tools, such as dashboards and interactive charts, are used to present key performance indicators (KPIs) and other metrics in a human-readable format. For example, a CEO might not have the time or technical expertise to sift through raw data in a data lake, but they can quickly grasp the company’s performance by viewing a bar chart that compares monthly revenue to the same period in the previous year.
Effective data visualization enables organizations to measure and monitor their performance, identify trends, and pinpoint areas that require attention. It serves as the starting point for strategic decision-making, helping companies address challenges and capitalize on opportunities. By presenting data in a clear and concise manner, this layer ensures that insights derived from the data framework are accessible to all stakeholders, from technical teams to top-level management.
Data Architecture
Definition
Data architecture is a critical component within any data ecosystem, serving as the blueprint for how data is collected, stored, processed, and utilized. Its primary purpose is to ensure that the architecture is not only robust but also easy to maintain, evolve, and adapt to the changing needs of the organization.
A well-designed data architecture provides clear guidelines and rules for implementing data solutions, ensuring that they are scalable, efficient, and capable of delivering value. Without a structured architecture, organizations risk creating fragmented systems where each project or department uses its own set of tools, databases, and naming conventions. This lack of standardization can lead to confusion, inefficiencies, and a significant increase in the time required to bring data solutions to market.
The importance of data architecture becomes evident when considering the broader picture. In many organizations, data is often siloed, with different teams using disparate systems and tools. This fragmentation can result in isolated “islands of data,” where only a few individuals understand the meaning or context of specific data points. A well-designed data architecture addresses this issue by creating a cohesive ecosystem that is both clear and readable. This clarity not only accelerates the development of data solutions but also ensures that all stakeholders, from developers to business users, can easily access and interpret the data they need.
The Role of Data Governance
Data governance is one of the foundational pillars of a robust data architecture. It encompasses the rules, practices, and policies that define how data is accessed, managed, and secured within an organization.
Definition
Data governance ensures that sensitive information, such as employee salaries, is accessible only to authorized personnel, such as the HR department, while restricting access for others. This level of control is essential for maintaining data security and compliance with regulatory requirements.
In addition to access control, data governance also includes tools and processes for ensuring data quality. Data quality is a critical aspect of any data ecosystem, as poor-quality data can lead to inaccurate analyses and flawed decision-making. Common data quality issues include missing data, inconsistent formatting, and errors during data ingestion. To address these challenges, organizations implement data quality rules that automatically detect and correct anomalies.
Example
If a data ingestion job fails, the system can trigger recovery processes to ensure that the data is accurately captured and processed. This proactive approach minimizes the risk of business users encountering errors in their reports, thereby reducing the need for troubleshooting and support tickets.
Another key component of data governance is the creation of a business glossary, that serves as a centralized repository for defining key metrics and KPIs, ensuring that all departments interpret them consistently. For example, consider the term “active customer.” In a company like Amazon, one department might define an active customer as someone who has made a purchase in the last three months, while another department might consider an active customer to be anyone who has clicked on the website within the same period. Such discrepancies can lead to conflicting reports and misaligned strategies, particularly when these insights are presented to senior management. A business glossary helps eliminate these inconsistencies by providing a standardized definition of key terms, ensuring that everyone in the organization is on the same page.
Project Management
Implementing a data architecture requires careful planning and execution, which is where project management comes into play. Project management focuses on defining the roadmap for a data initiative, including its goals, timelines, budget, and staffing requirements. Effective project management ensures that the project stays on track, meets its milestones, and delivers value within the allocated resources.
For example, a project manager might oversee the deployment of a new data lake, coordinating with technical teams to ensure that data is ingested, processed, and stored correctly. They also monitor the project’s progress, addressing any issues that arise and ensuring that the final solution aligns with the organization’s strategic objectives.
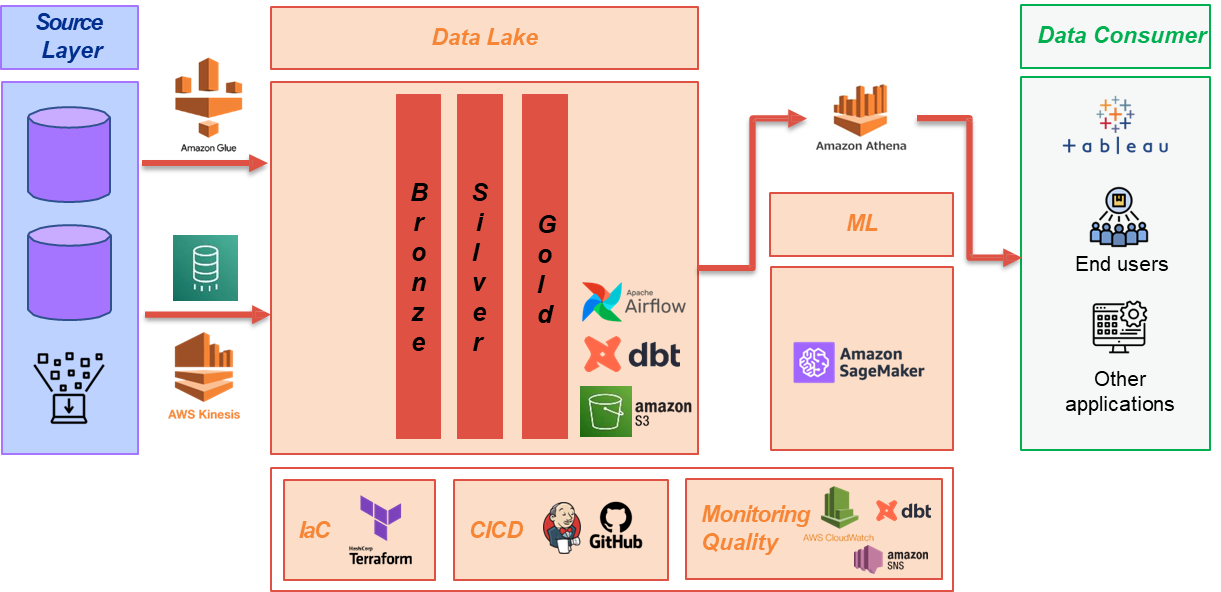
A Practical Example of Data Architecture
To illustrate how data architecture works in practice, consider a typical enterprise data ecosystem built on AWS (Amazon Web Services). The architecture begins with the source layer, which includes operational databases from various applications such as e-commerce platforms, HR systems, and retail stores. Data from these sources is ingested into a centralized data lake using AWS services like AWS Glue or Amazon Kinesis. The data lake serves as the primary storage repository, where raw data is initially stored in its original format.
Once the data is ingested, it undergoes a series of transformations to prepare it for analysis. This process is often orchestrated using tools like Apache Airflow, which automates the workflow and ensures that data is processed efficiently. The transformed data is then organized into different layers within the data lake. The first layer, often referred to as the “bronze layer,” contains raw data in its original state. The next layer, the “silver layer,” includes cleaned and partially processed data, while the final “gold layer” contains fully refined data that is ready for analysis. In the gold layer, data is structured into tables that represent key business entities, such as customers, orders, and employees. This structured format eliminates any dependencies on the original operational systems, providing a single source of truth for the entire organization.
The final stage of the architecture involves data analytics and visualization. Machine learning models and analytical tools are applied to the refined data to generate insights, such as customer segmentation or sales forecasts. These insights are then presented to business users through dashboards and reports, enabling them to make data-driven decisions.
Data Job Roles
The field of data science and engineering encompasses a wide range of job roles, each with distinct responsibilities and skill sets. These roles are critical for organizations looking to harness the power of data to drive decision-making, innovation, and business growth.
| Role | Description |
|---|---|
| Data Architect | Designs and implements data architectures that align with the organization’s business goals and technical requirements. |
| Cloud Architect | Focuses on designing solutions that leverage cloud platforms for data storage, processing, and analytics. |
| Data Engineer | Constructs and maintains data pipelines that move data from source systems to data warehouses or data lakes. |
| Data Analyst | Interprets data to provide actionable insights that support decision-making. |
| Data Scientist | Applies advanced techniques such as machine learning, deep learning, and generative AI to uncover hidden patterns and make predictions. |
| Data Privacy and Security Officer | Ensures compliance with data protection laws and implements technical measures to protect data from unauthorized access or cyberattacks. |
Data and Cloud Architects
Data and cloud architects play a pivotal role in shaping the data infrastructure of an organization. Their primary responsibility is to design and implement data architectures that align with the organization’s business goals and technical requirements. This involves selecting the most appropriate services, frameworks, and models to create a scalable, efficient, and cost-effective data ecosystem.
Example
For example, a cloud architect might choose between AWS, Google Cloud, or Microsoft Azure to build a data storage and processing solution that meets the organization’s needs. They also define the high-level structure of the data ecosystem, ensuring that it can handle large volumes of data while remaining flexible enough to adapt to future requirements.
Cloud architects, in particular, focus on designing solutions that leverage cloud platforms for data storage, processing, and analytics. They must balance scalability, performance, and cost-effectiveness, often using services like Amazon S3 for storage, AWS Lambda for serverless computing, and Amazon Redshift for data warehousing. The data architect, on the other hand, ensures that the overall architecture supports the organization’s data strategy, including data integration, governance, and security. Together, these roles lay the foundation for a robust data ecosystem that enables advanced analytics and machine learning.
Data Engineers
While data architects design the blueprint, data engineers are responsible for constructing and maintaining the data infrastructure. They focus on building scalable and efficient data pipelines that move data from source systems, such as transactional databases or IoT devices, to data warehouses or data lakes. Data engineers work with technologies like Apache Spark, Apache Kafka, and ETL (Extract, Transform, Load) tools to transform raw data into meaningful formats that can be used for analysis.
A significant part of a data engineer’s role involves ensuring data quality and consistency. They develop workflows to clean, process, and validate data, often using tools like Apache Airflow for orchestration. For example, a data engineer might create a pipeline that ingests sales data from multiple retail stores, cleans it to remove duplicates or errors, and loads it into a centralized data warehouse. This processed data becomes the single source of truth for the organization, enabling analysts and data scientists to derive insights.
Data Analysts
Data analysts serve as the bridge between technical teams and business users. Their primary focus is on interpreting data to provide actionable insights that support decision-making. Data analysts clean and preprocess data, conduct statistical analyses, and create visualizations to help business users understand trends, patterns, and areas for improvement. They also define key performance indicators (KPIs) and metrics that align with the organization’s strategic goals.
Example
For example, a data analyst might analyze sales data to identify seasonal trends or customer preferences. They could then create a dashboard that visualizes this information, making it accessible to non-technical stakeholders like marketing teams or executives.
Data analysts often use tools like SQL for querying databases, Python or R for statistical analysis, and Tableau or Power BI for data visualization. Their work is crucial for ensuring that data-driven insights are communicated effectively across the organization.
Data Scientists
Data scientists take data analysis to the next level by applying advanced techniques such as machine learning, deep learning, and generative AI. Unlike data analysts, who focus on deterministic analysis, data scientists explore data in a non-deterministic way, using algorithms to uncover hidden patterns and make predictions.
Data scientists work closely with data engineers to access and preprocess data, and they often use frameworks like TensorFlow, PyTorch, and Scikit-learn to build and deploy machine learning models. Their role also involves experimenting with new techniques and technologies, such as natural language processing or computer vision, to solve complex business problems.
Data Privacy and Security Officers
In an era of increasing data breaches and stringent regulations, data privacy and security officers play a critical role in protecting an organization’s information assets. The data privacy officer ensures compliance with data protection laws such as the General Data Protection Regulation (GDPR), implementing policies and strategies to safeguard sensitive and personal data. This includes encrypting data at rest and in transit, conducting regular audits, and training employees on data protection best practices.
The data security officer, on the other hand, focuses on implementing technical measures to protect data from unauthorized access or cyberattacks. This might involve deploying firewalls, intrusion detection systems, and multi-factor authentication. Both roles require a deep understanding of regulatory requirements and the ability to balance security with usability.